Monitoring
By default, AWS Lambda publishes PHP logs and metrics to AWS CloudWatch . These include HTTP response times, code execution duration, error rates, and more.
Here is a summary of recommended tools for monitoring Bref applications:
- Logs and metrics: CloudWatch (built-in), Bref Cloud
- Error tracking: Sentry and similar services
- Tracing and performance insights: Bref Cloud with X-Ray
Let’s dive into the details of each of them.
Sentry
Sentry is a popular error tracking service. It works well out of the box with Bref for HTTP applications: install the Sentry SDK for PHP (or the Laravel or Symfony integrations) and errors will be tracked automatically.
For more advanced use cases, such as tracking Lambda errors outside of PHP-FPM (timeouts, oversized responses…), monitoring event-driven handlers (SQS, EventBridge, S3…), or tracking cold starts and AWS SDK calls, the Bref Sentry package extends Sentry’s capabilities for AWS Lambda. It is available as a separate license.
Bref Cloud
Bref Cloud monitors serverless PHP applications. It reads logs, metrics and traces from your AWS account. There is no agent to install.
Overview
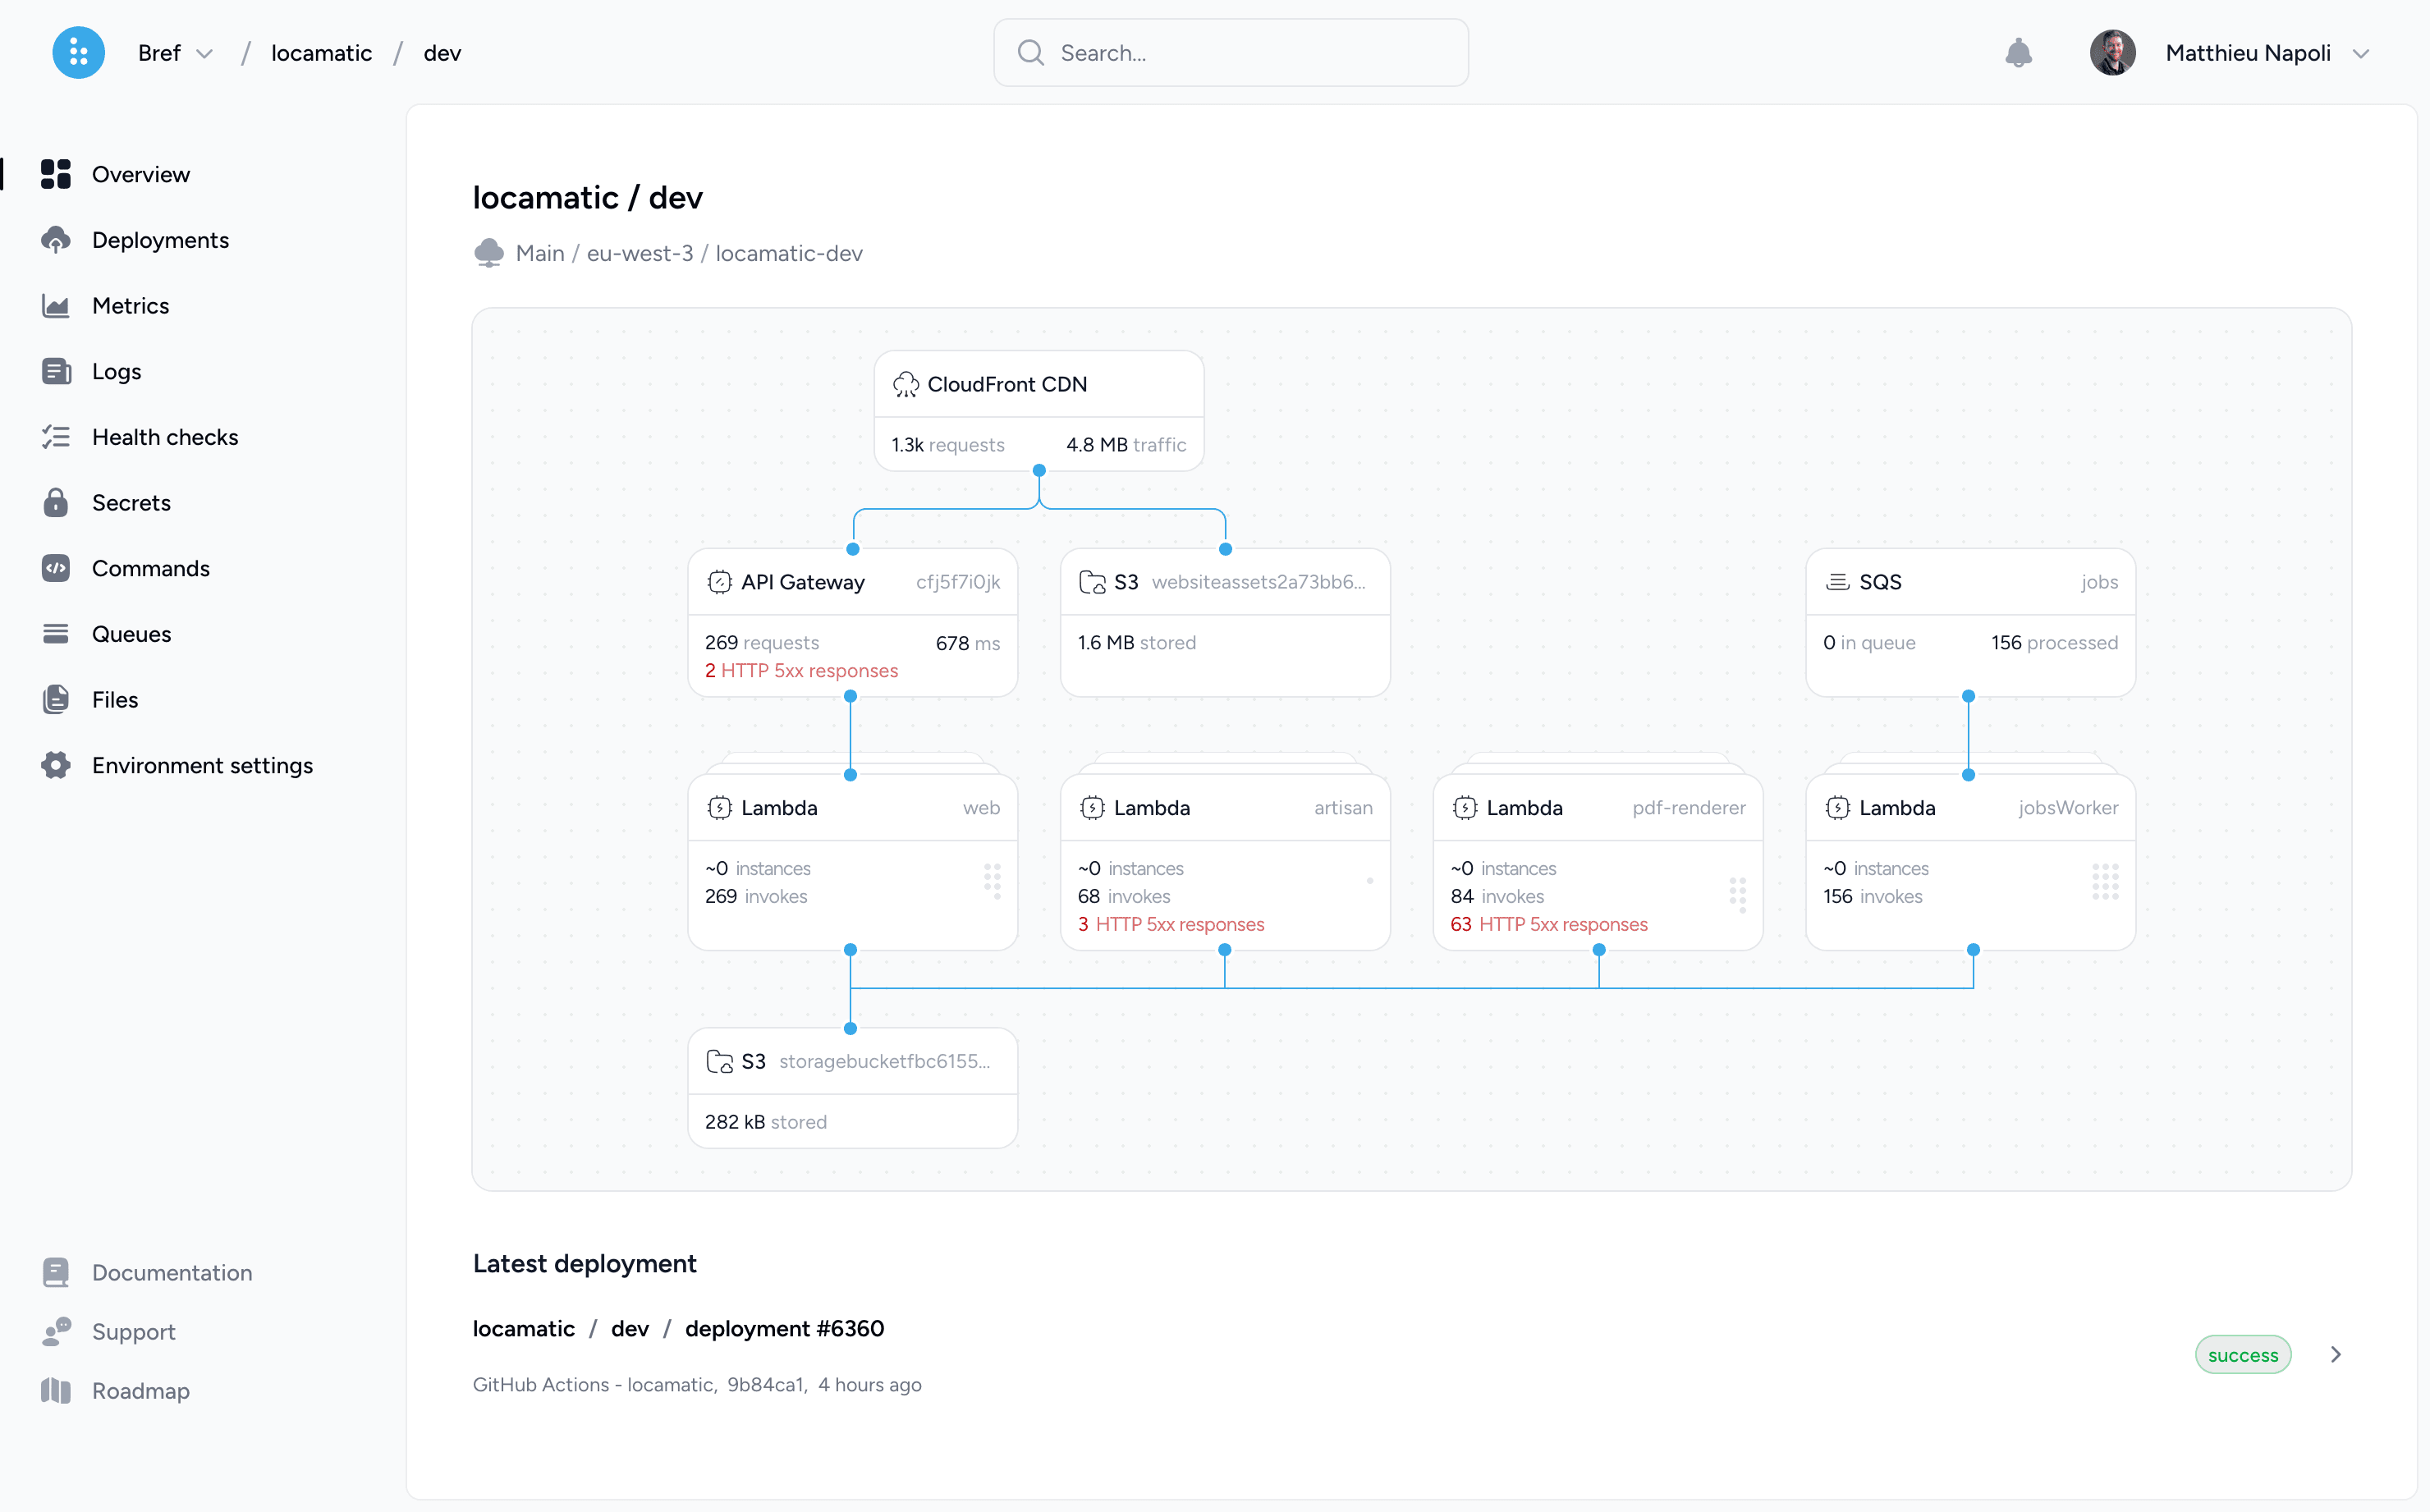
The overview page shows a diagram of the environment: Lambda functions, API Gateway, CloudFront, SQS queues, S3 buckets and databases. Each component shows live metrics: requests, invocations, errors, queue size, storage.
Logs
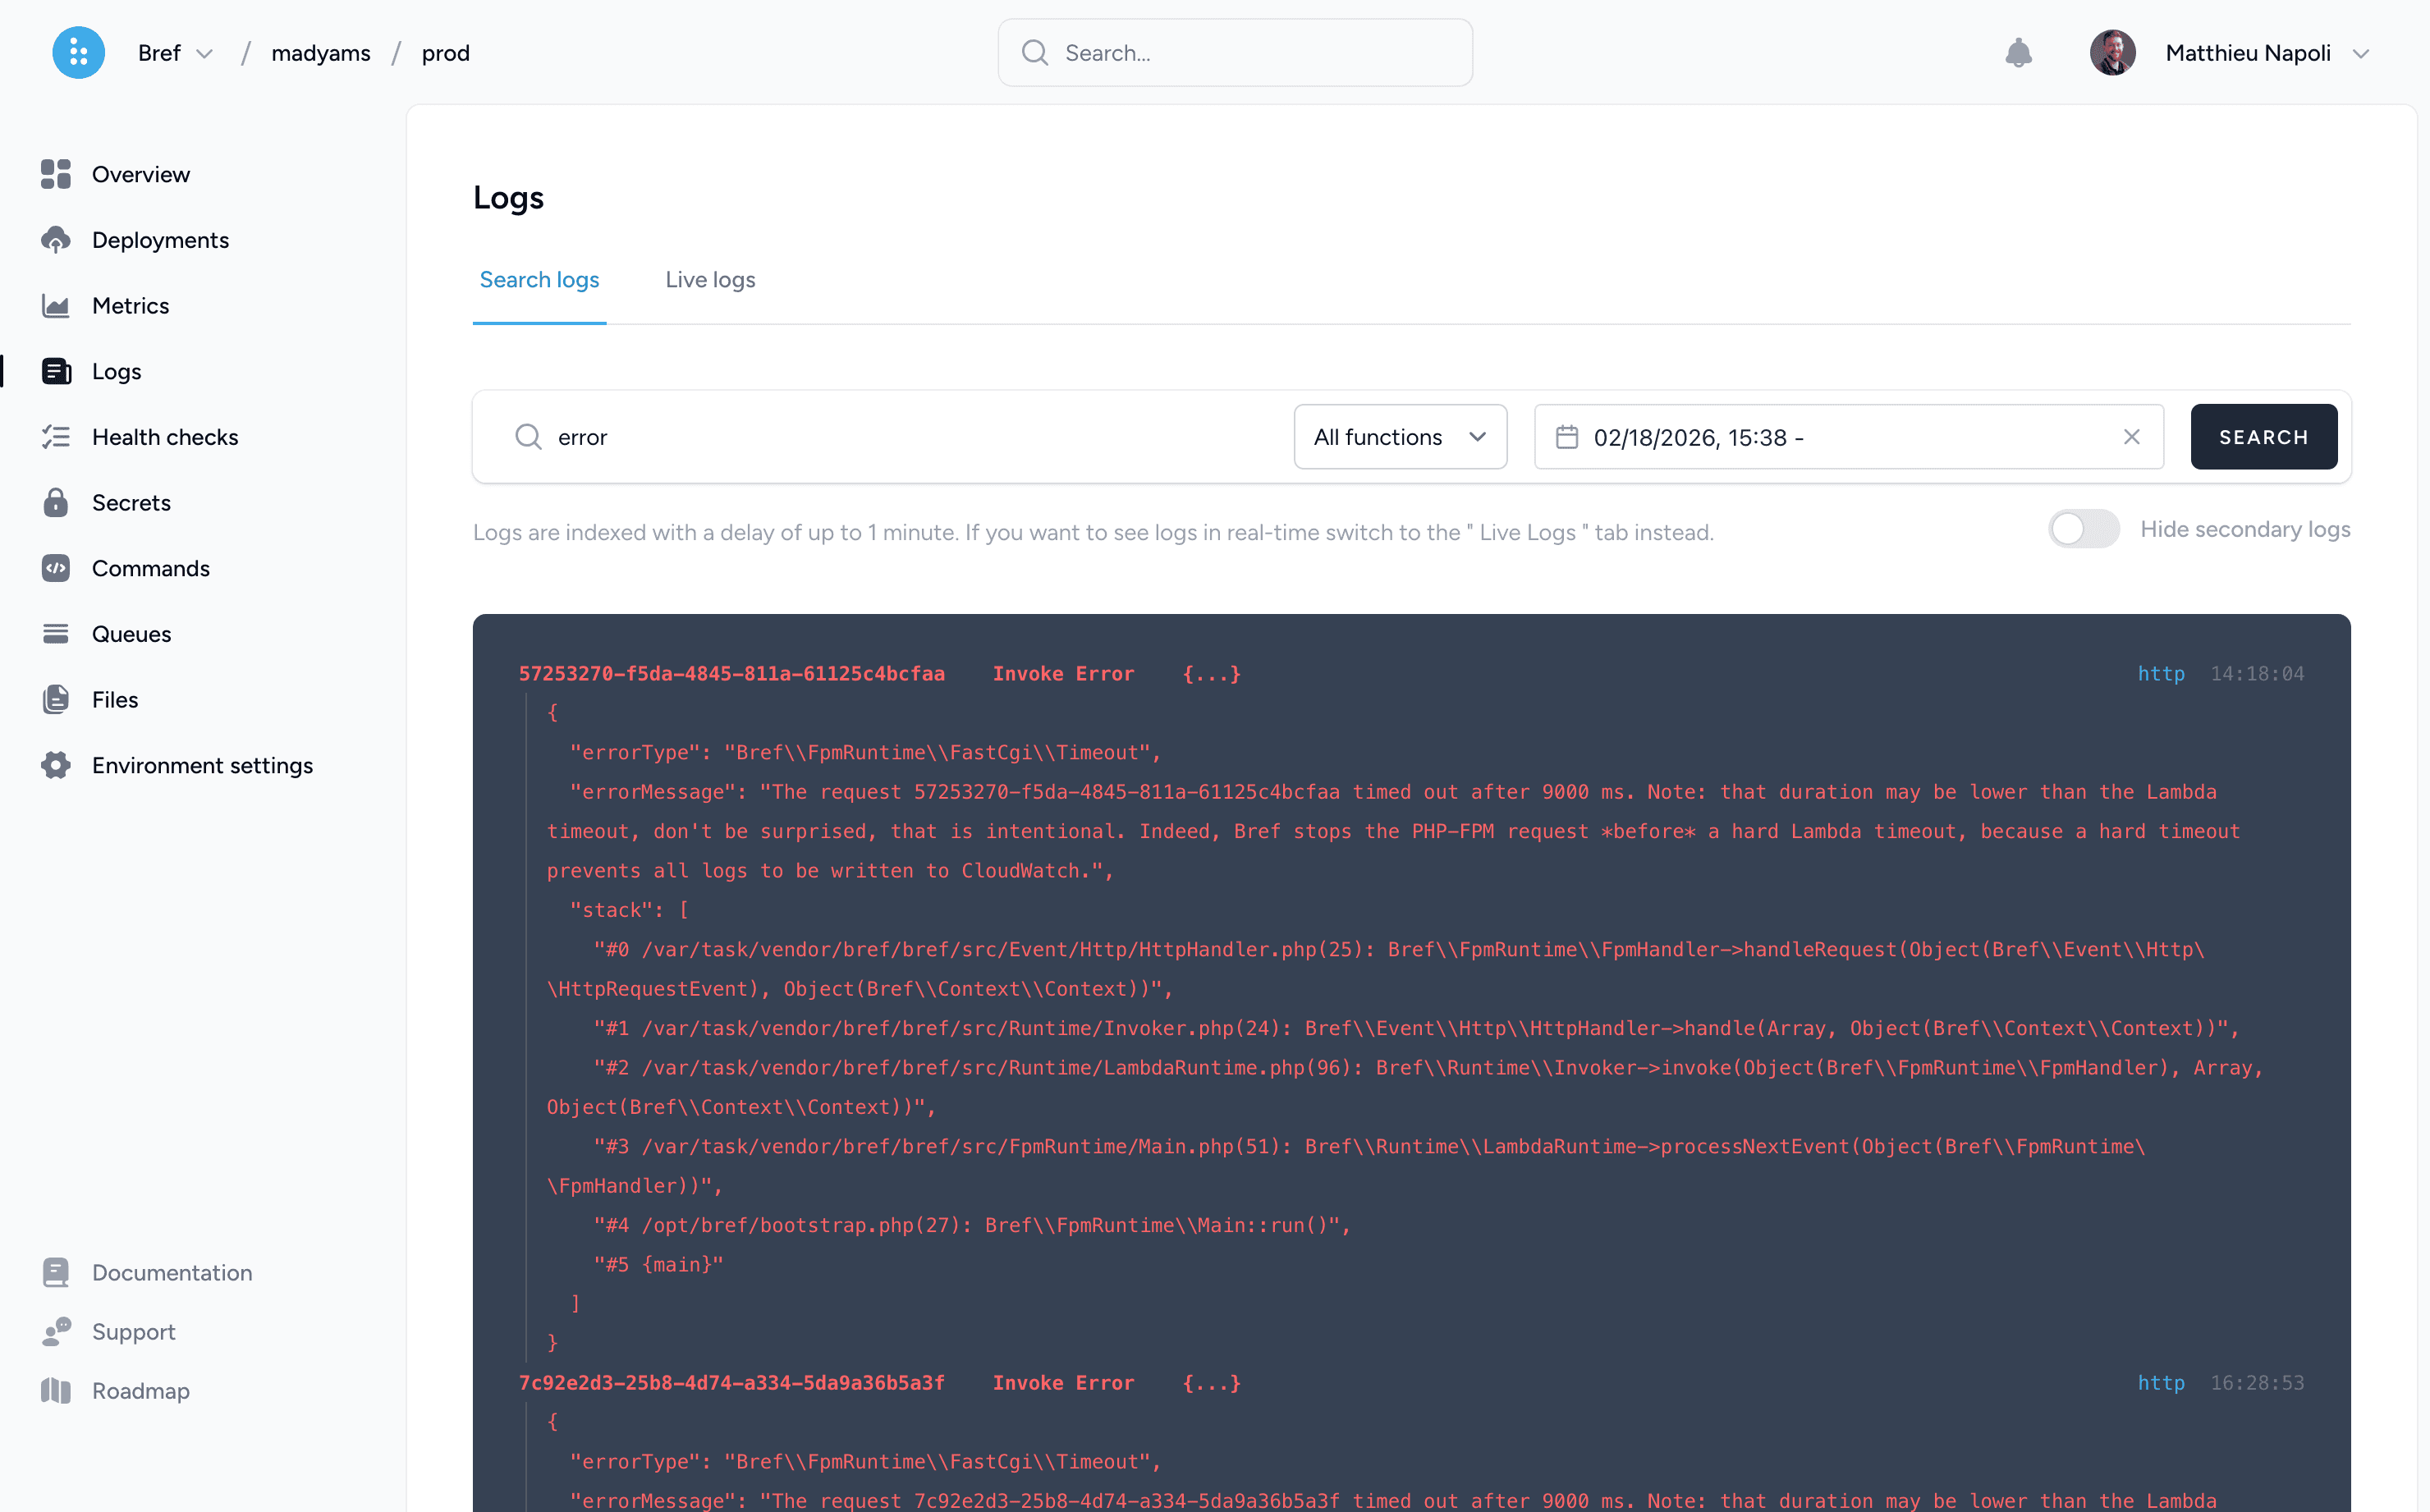
View, search and tail CloudWatch logs. Laravel and Symfony logs are structured: you can filter them by log level or exception class.
Logs can also be searched from the terminal with the bref logs command.
Metrics
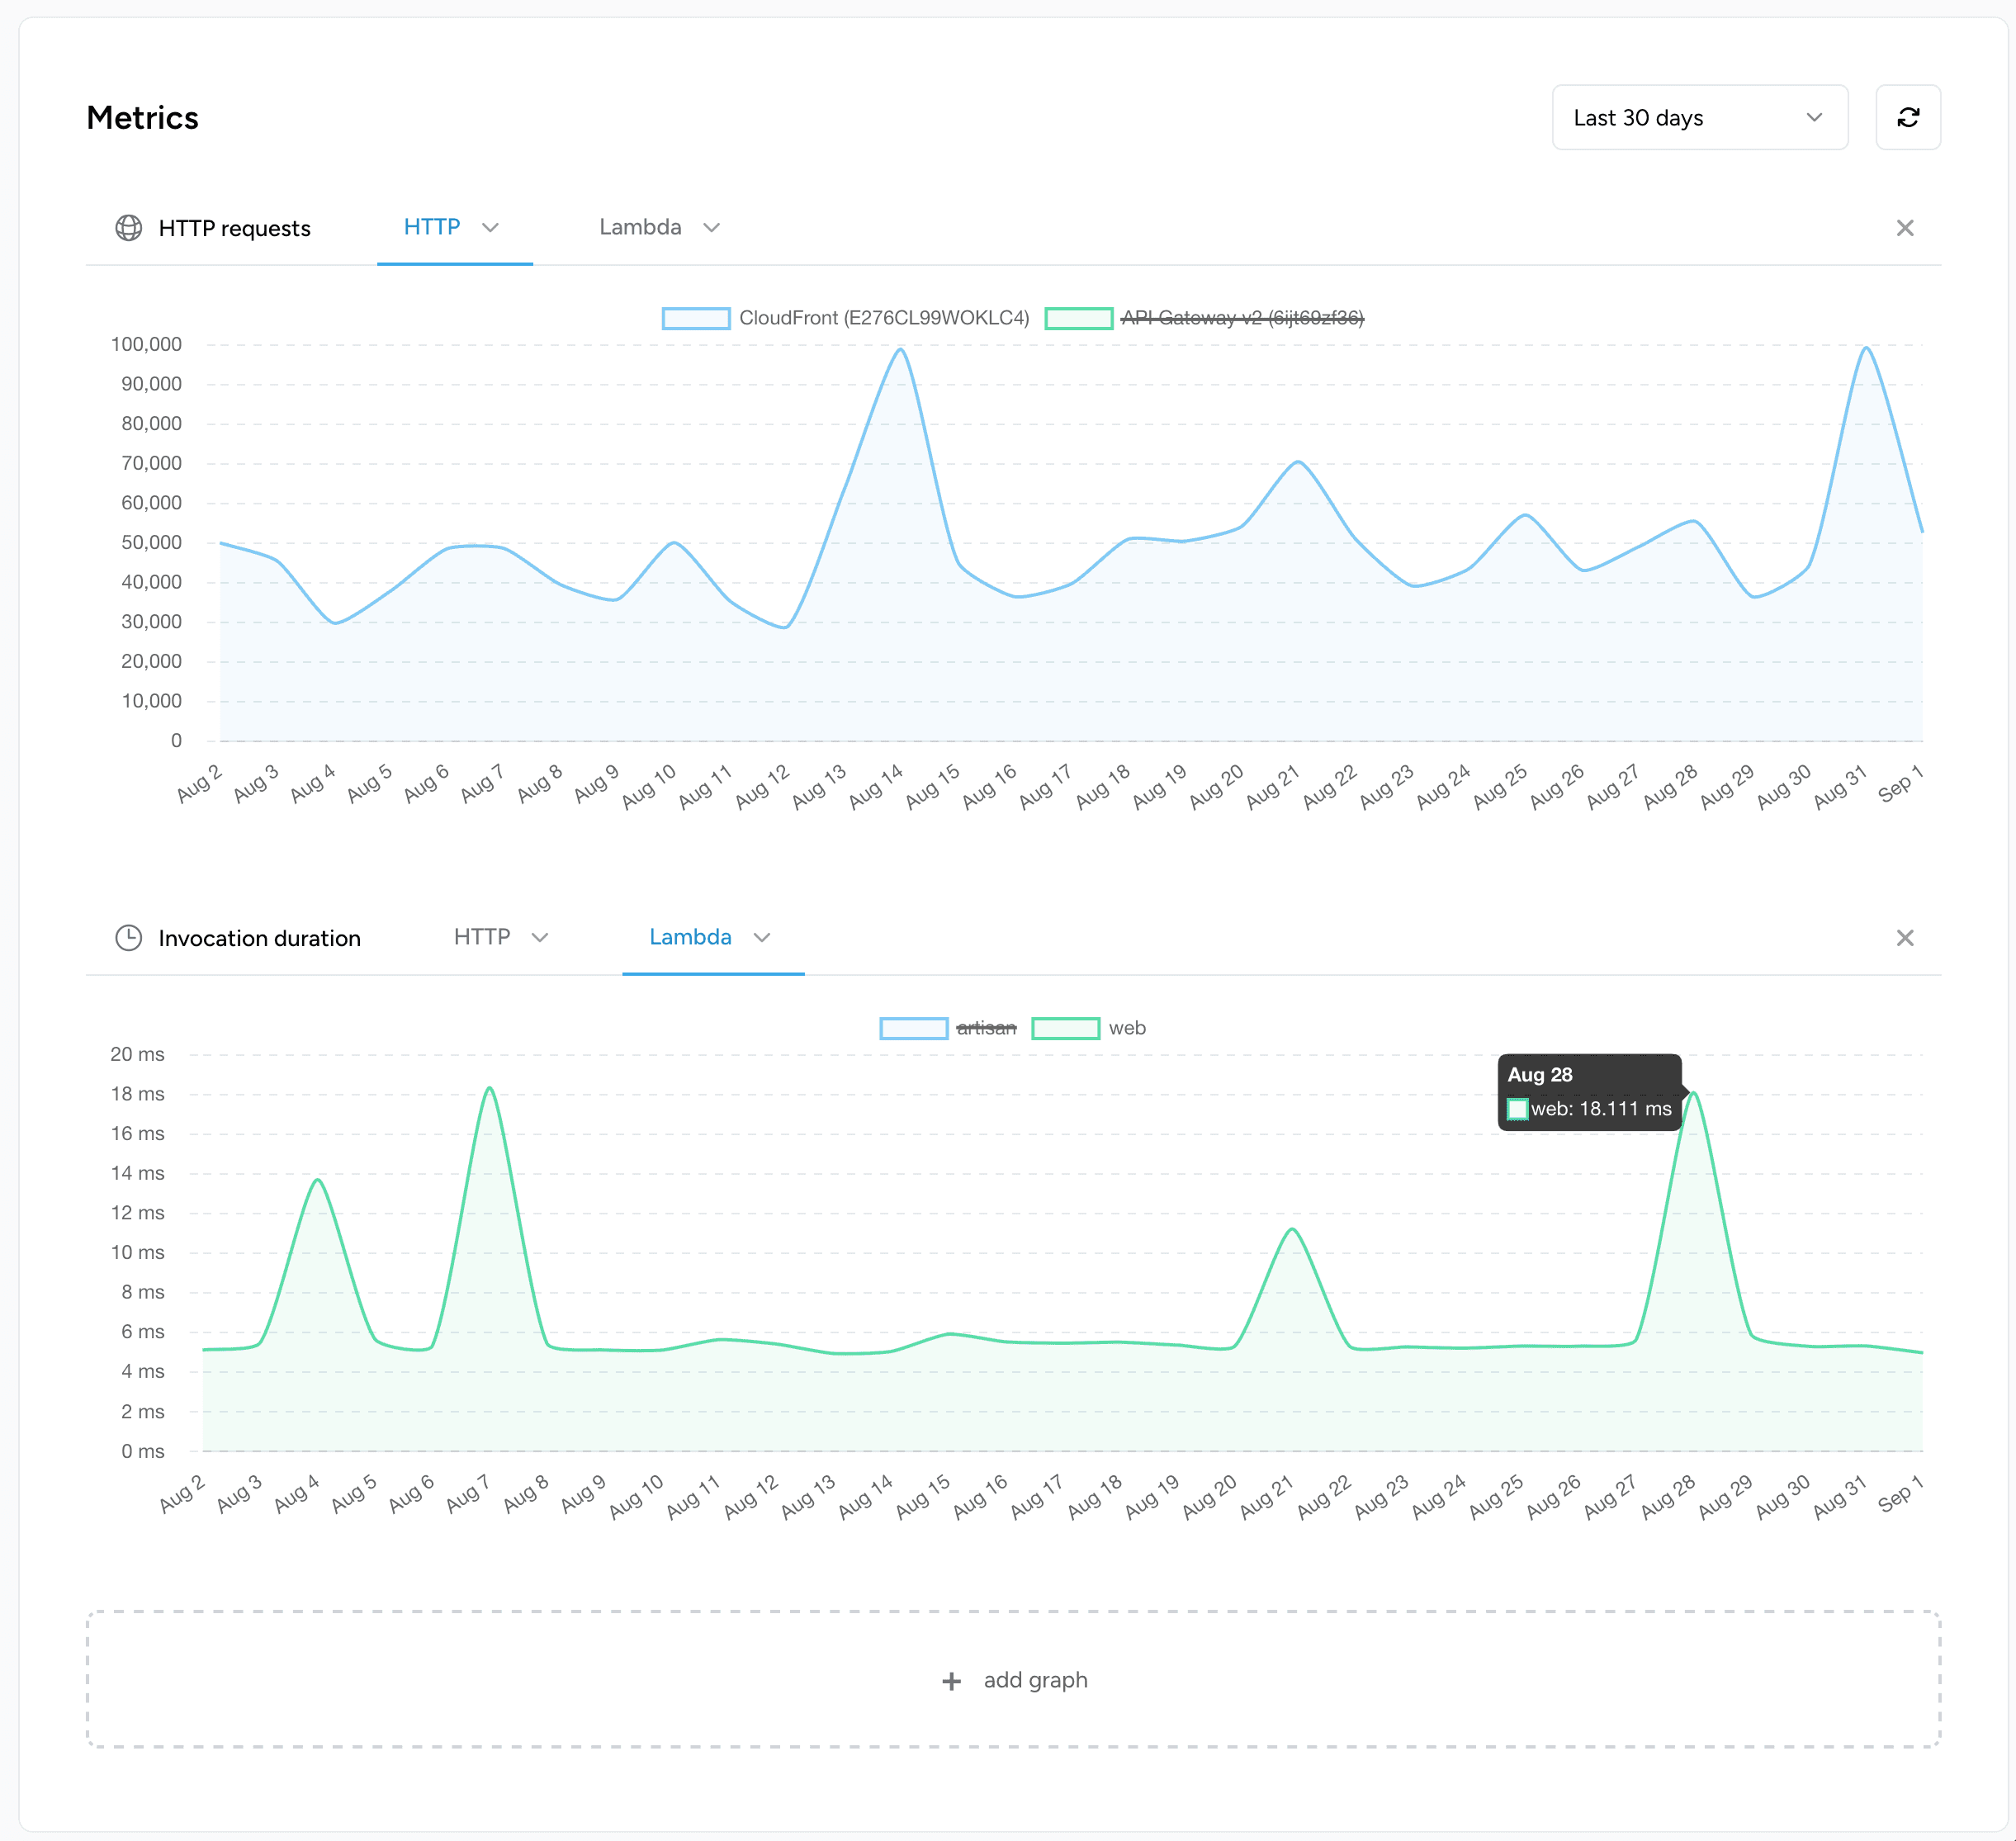
The metrics page shows Lambda invocations, duration and errors, as well as API Gateway requests and latency. Queue metrics can also be found in the “Queues” page. You can add graphs to compare metrics over up to 30 days.
Traces
A trace shows what happens inside an invocation: PHP code, database queries, HTTP calls, and AWS SDK calls. For each AWS call, the trace shows the queue, table, or topic it used.
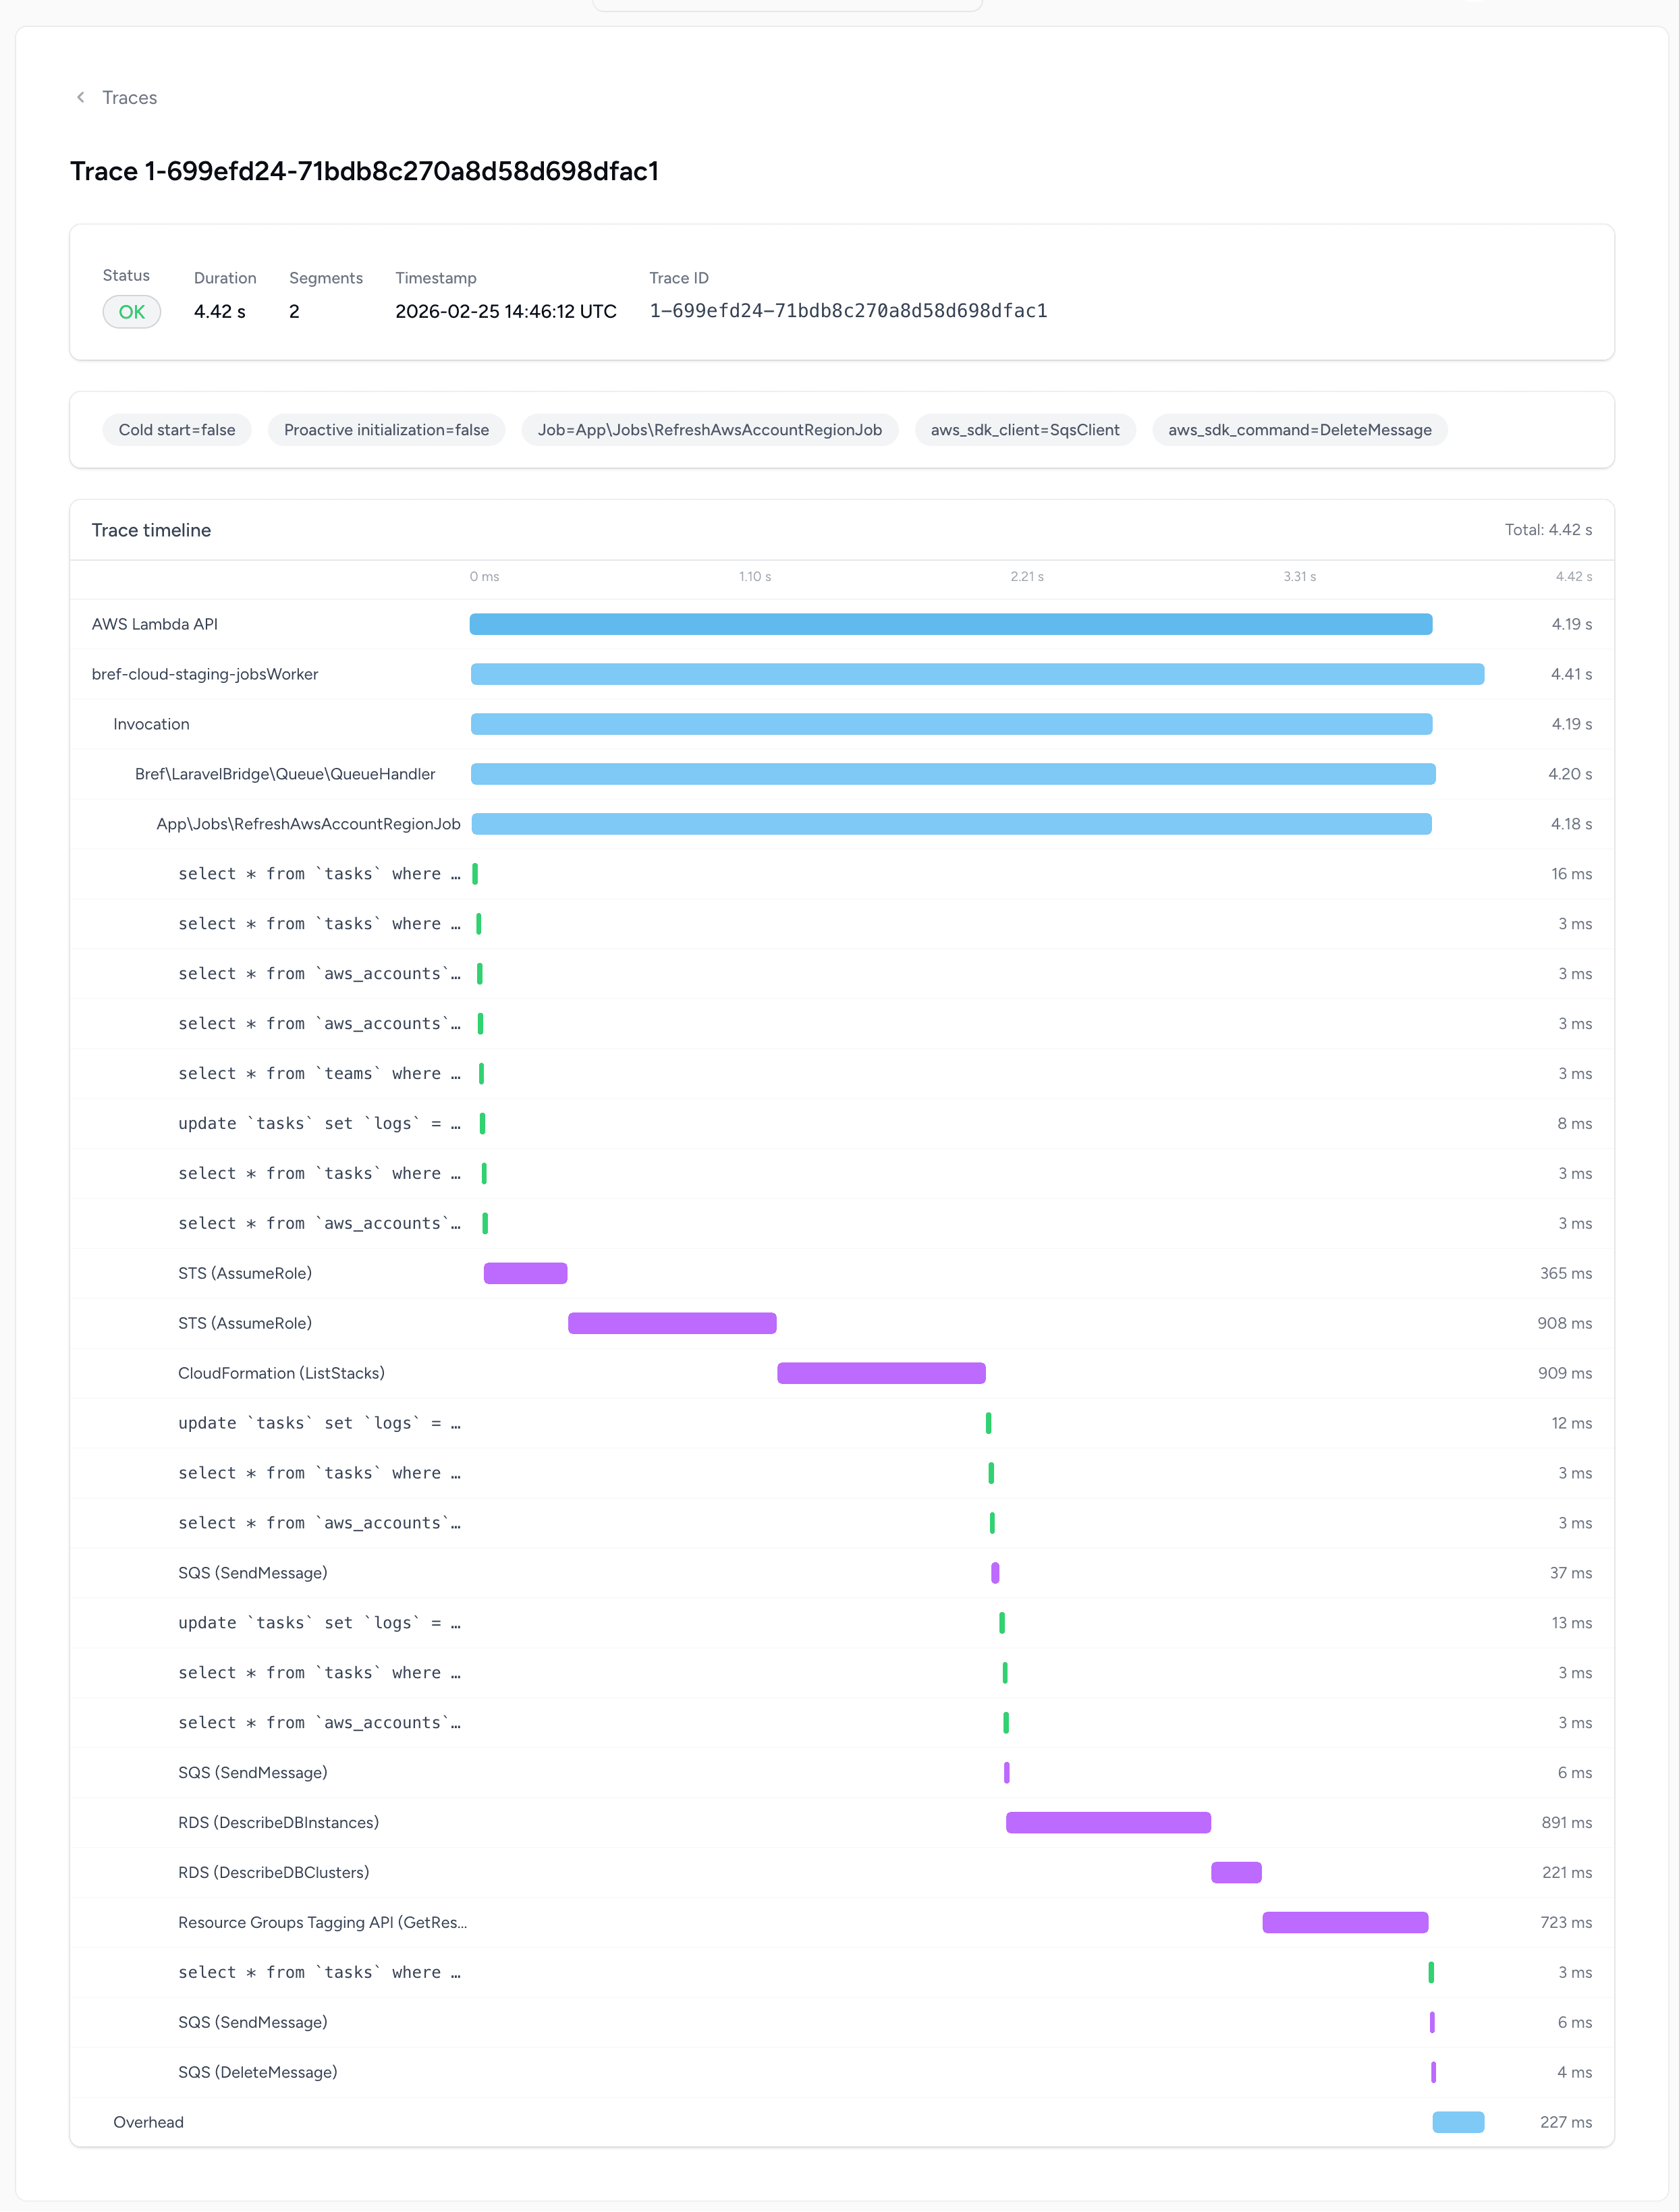
The Bref X-Ray package adds annotations to traces: route, controller, job class, CLI command, cold start. You can add your own annotations, for example the tenant or the plan of the user. The trace explorer uses annotations as filters. For example, you can list all the traces of one route, of one job, of one tenant, or all the invocations with a cold start.
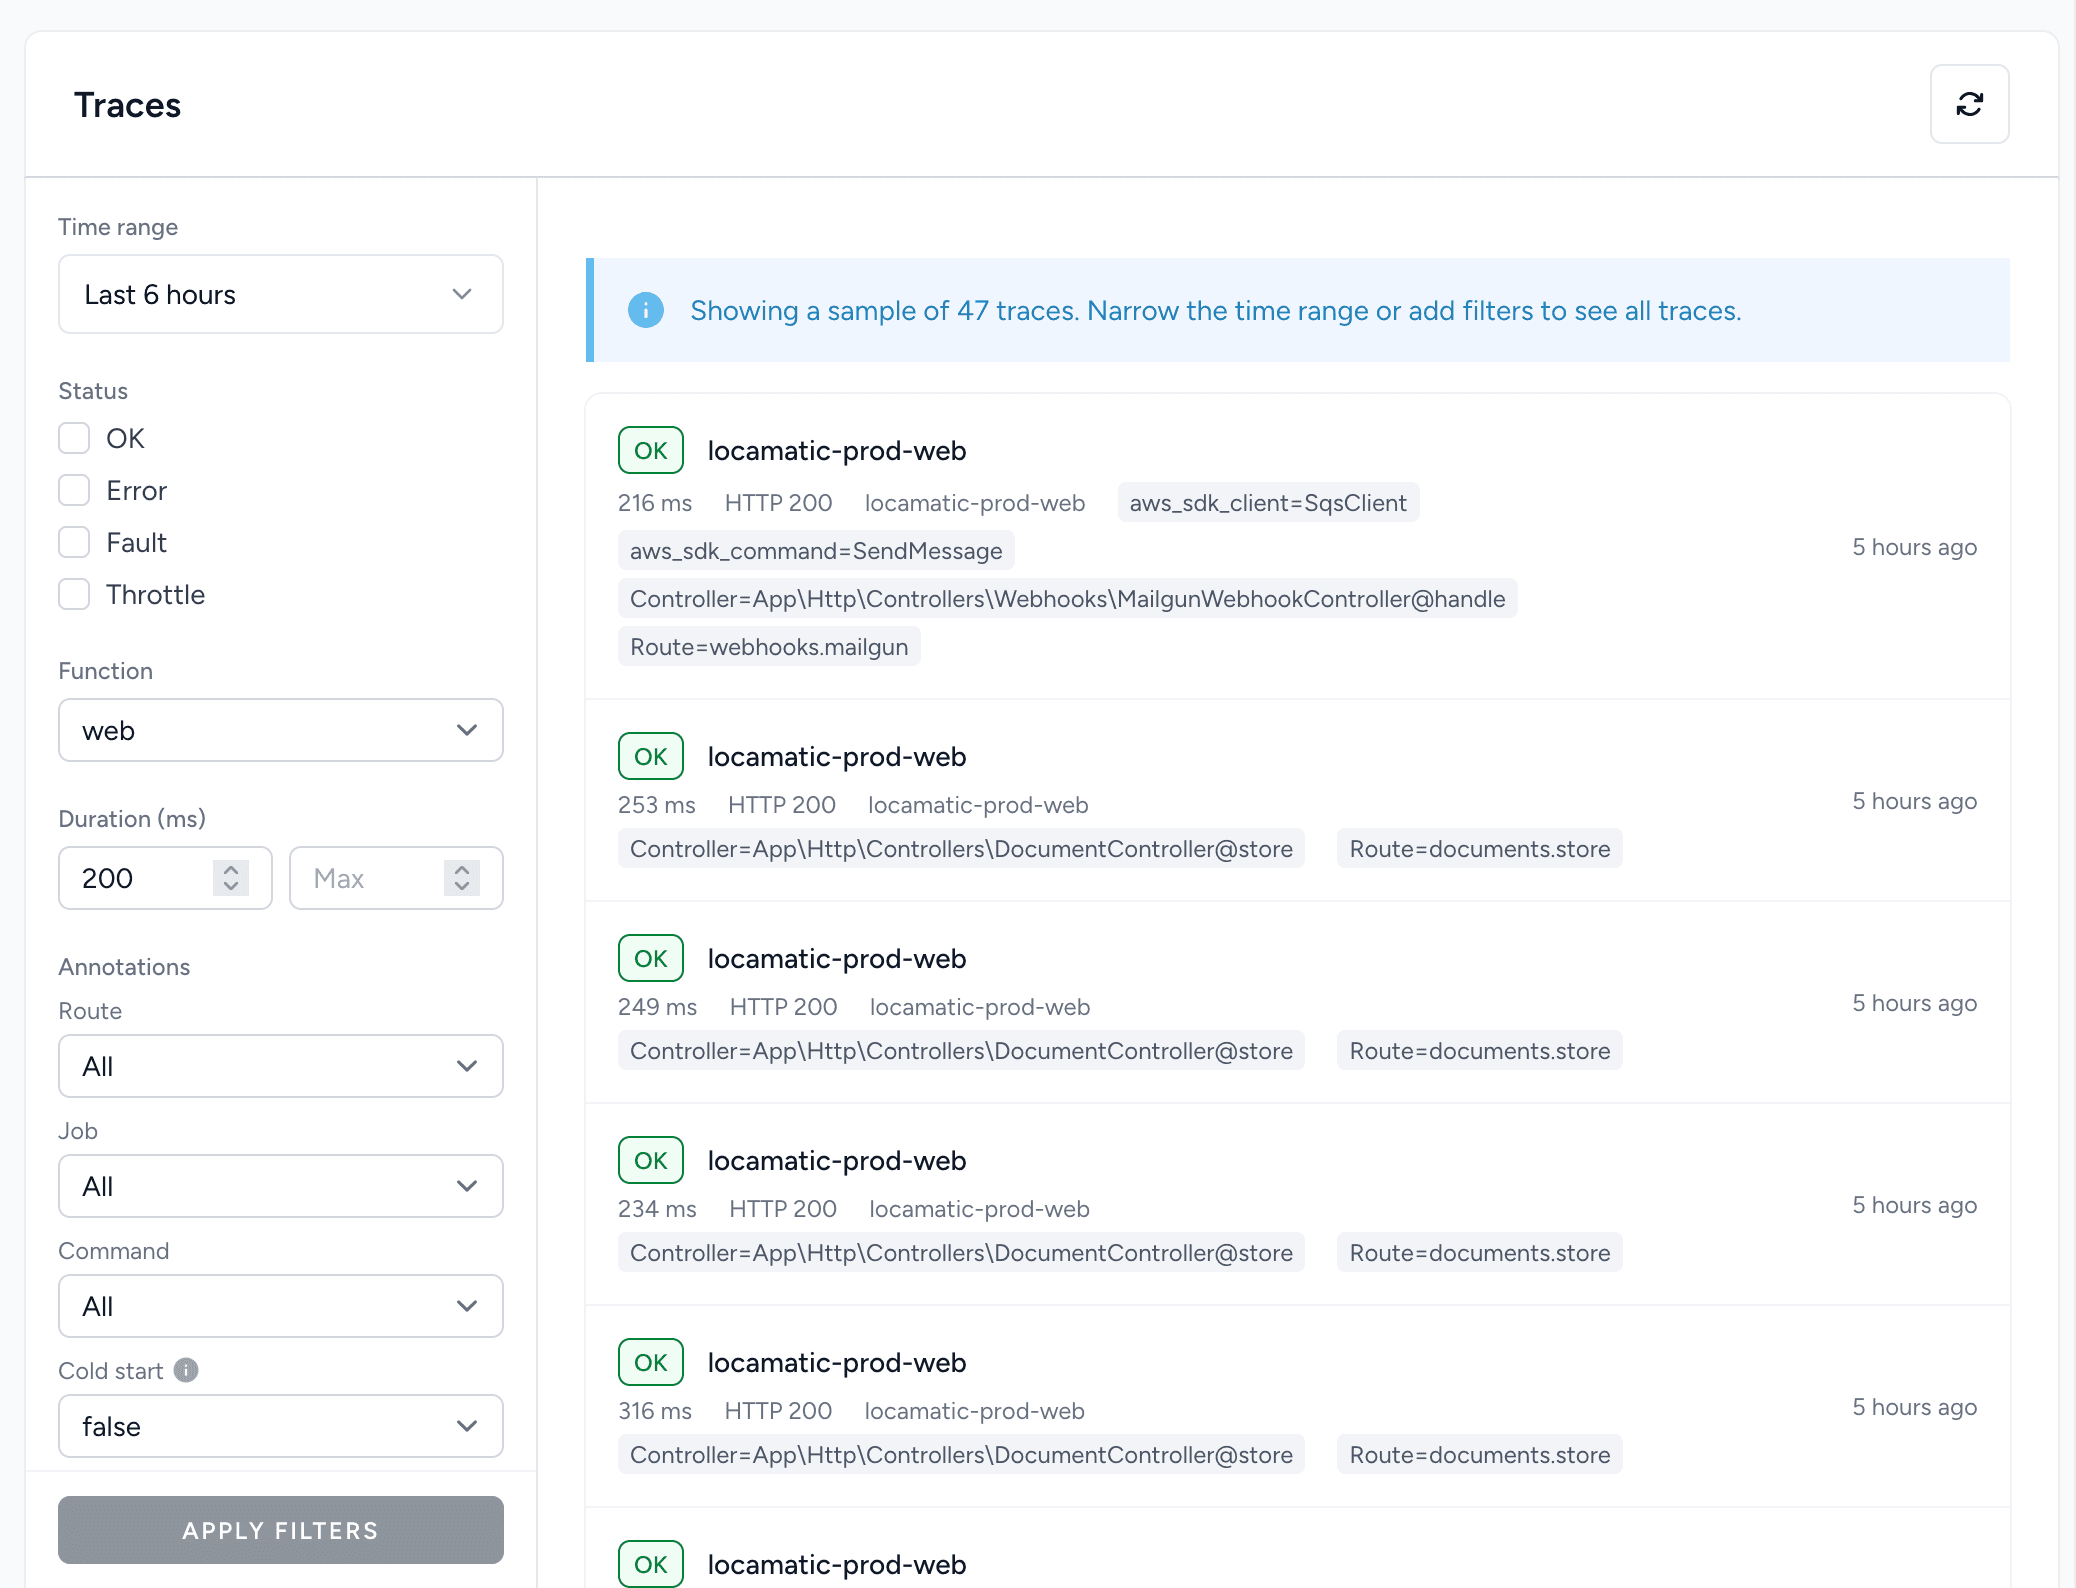
Enable AWS Transaction Search on your AWS account, and the trace explorer searches up to 30 days of traces instead of 6 hours. It is a one-time switch in the AWS console.
Performance
The Performance page aggregates the traces of the last 30 days. It shows the slowest database queries, the latency of each route, and the slowest jobs.
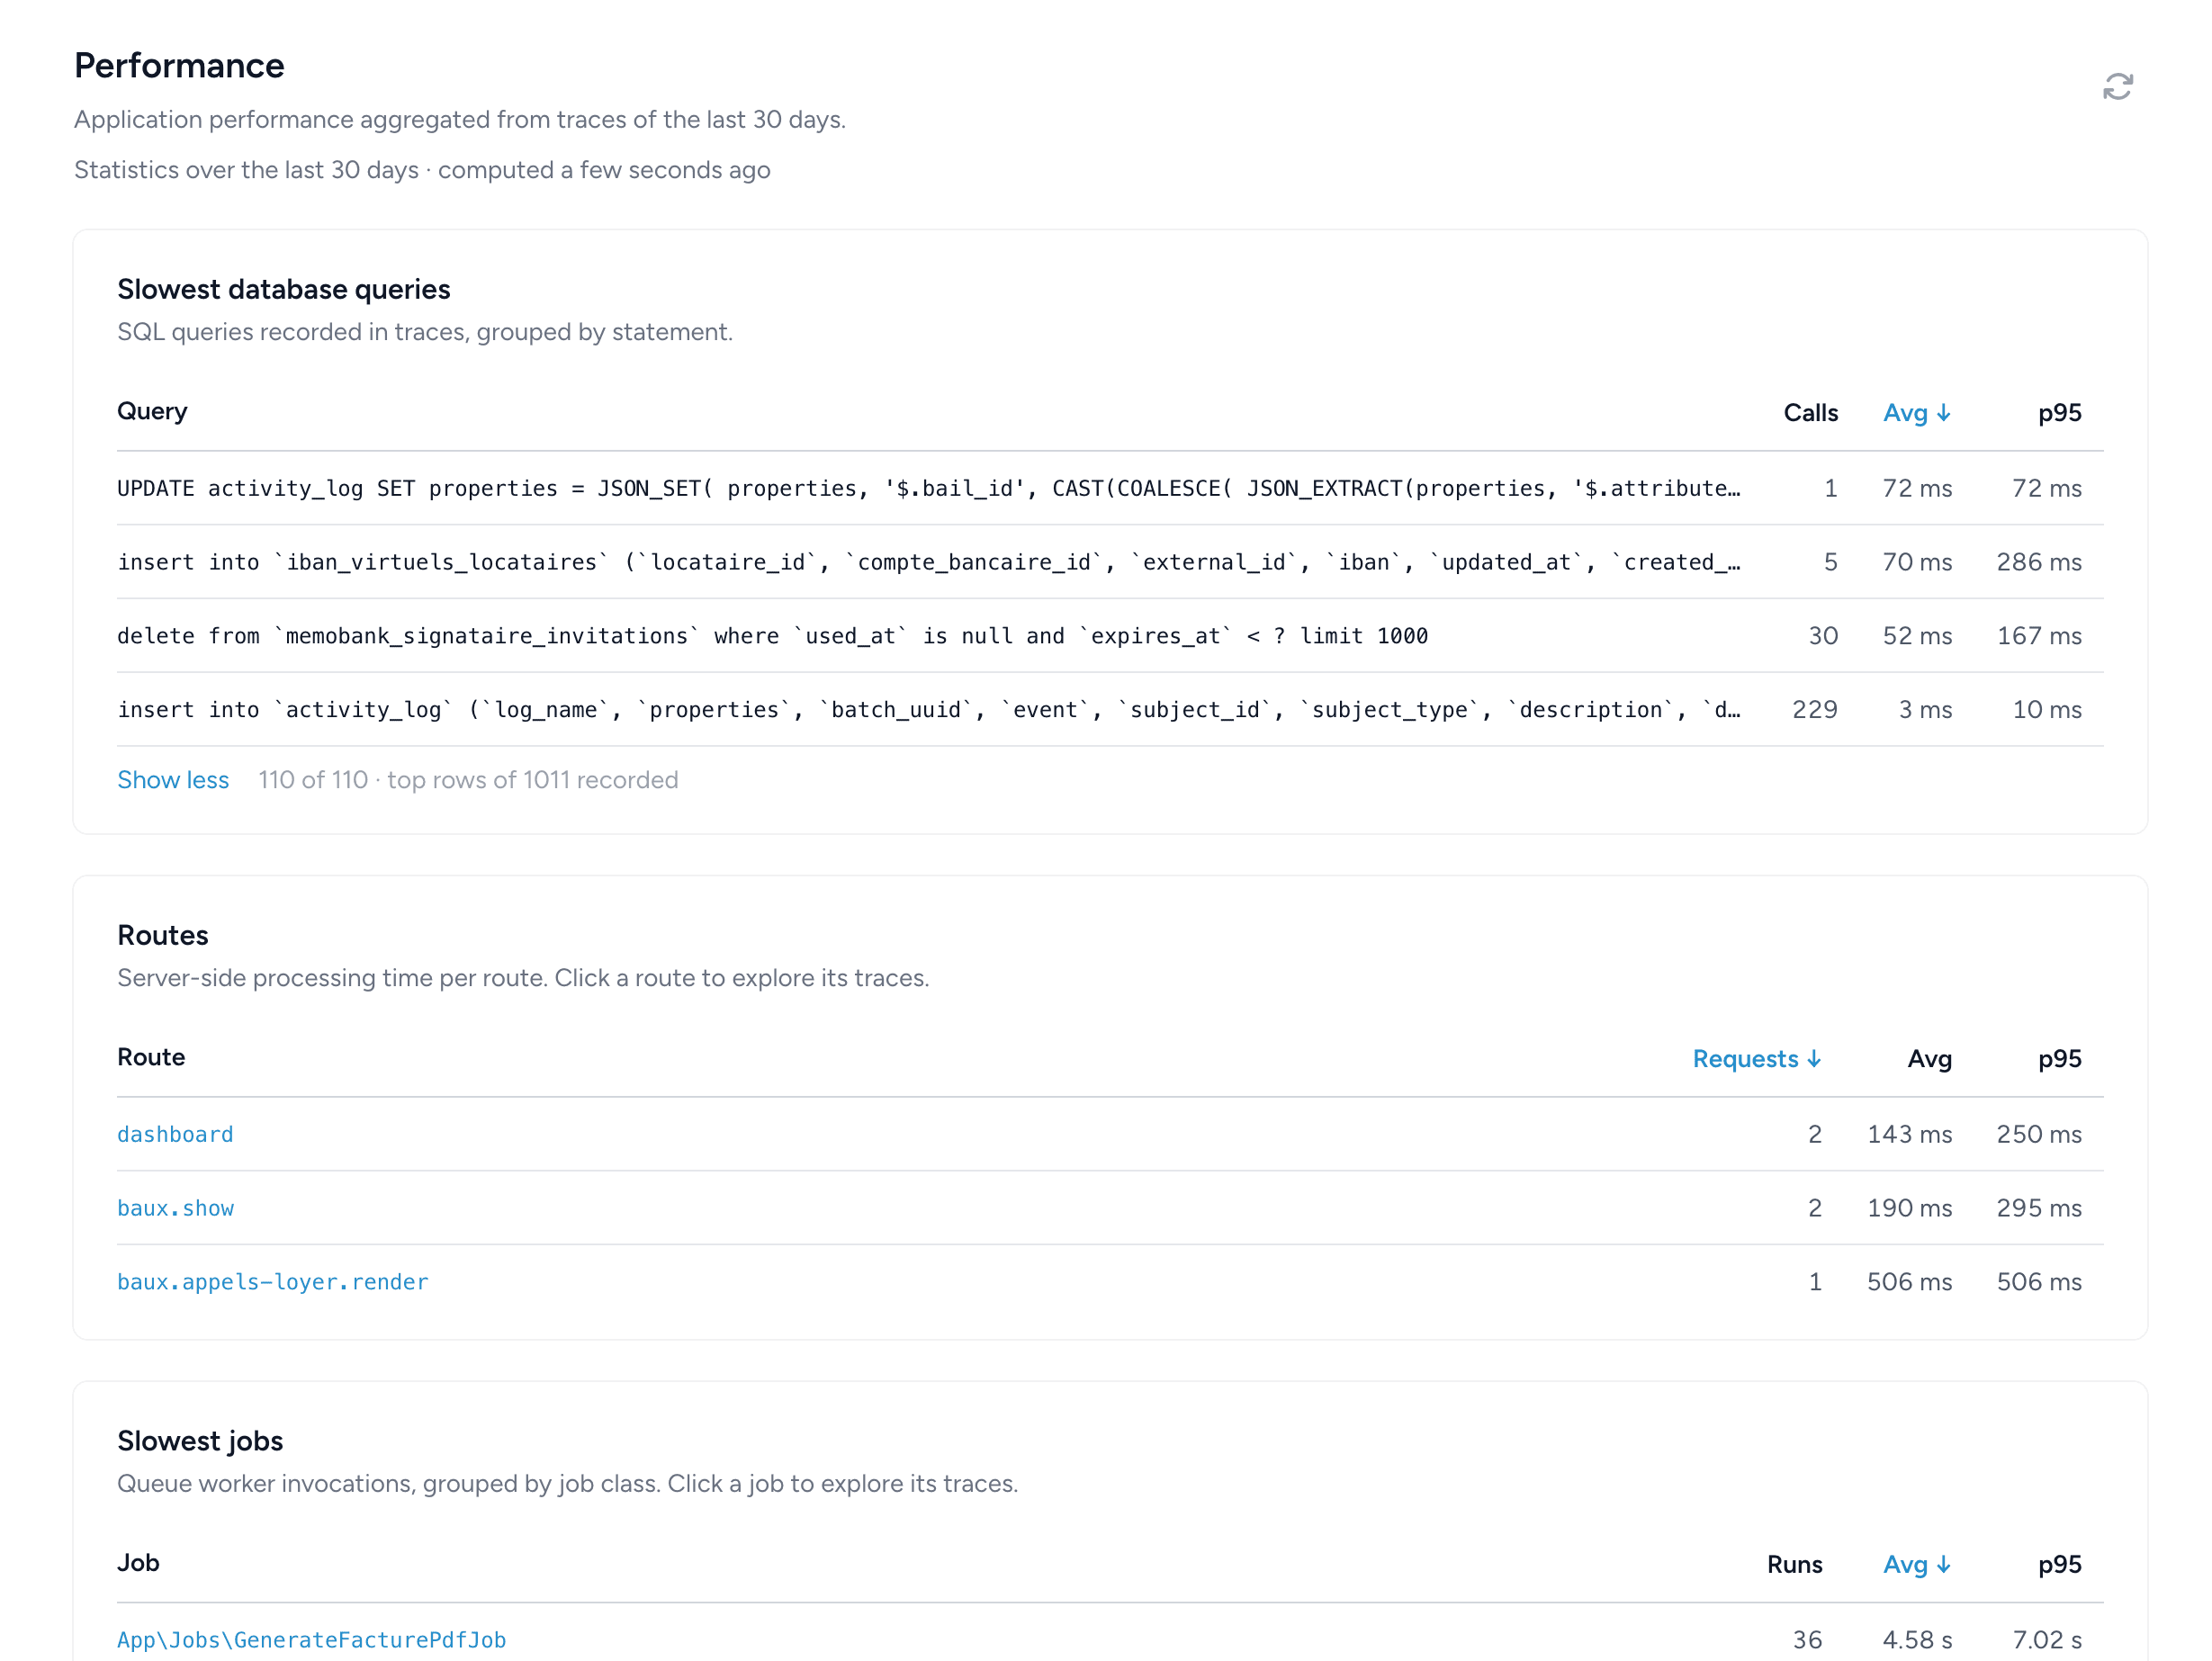
- Slowest database queries: SQL queries grouped by statement, with the number of calls, the average duration and the p95 duration.
- Routes: server-side processing time per route, sorted by number of requests or by latency. Click a route to open its traces.
- Slowest jobs: queue worker invocations grouped by job class. Click a job to open its traces.
The page requires the Bref X-Ray package in the application and Transaction Search on the AWS account. After that, there is nothing else to configure. Bref Cloud computes the statistics when you open the page, caches them for 24 hours, and lets you recompute them at any time. The statistics only include traced invocations (see the X-Ray sampling rate).
Failed jobs and health checks
Laravel applications have a “Failed jobs” tab next to their queues. It shows the exception of each failed job. You can retry, delete or flush jobs from there.
Health checks check that a deployed application works: the database is reachable, the cache works, the Lambda functions use the recommended settings. Laravel only for now.
X-Ray license
Bref Cloud paid plans include a free Bref X-Ray license. To activate it, contact support via bref.cloud/support or Slack .
X-Ray
AWS X-Ray provides distributed tracing for Lambda applications. The Bref X-Ray package integrates X-Ray with PHP, tracking cold starts, database queries, HTTP calls, AWS SDK calls, and more. It supports both Laravel and Symfony.
The package can be used with or without Bref Cloud. Bref Cloud users get a free license (see above), while others can purchase a standalone license.
Sentry Lambda package
As mentioned above, the standard Sentry SDK works great for HTTP applications. The Bref Sentry package goes further by adding Lambda-specific capabilities: tracking errors outside of PHP-FPM, monitoring event-driven handlers, and tracking cold starts.
The package can be used with or without Bref Cloud. It is available as a standalone license.
Bref Dashboard
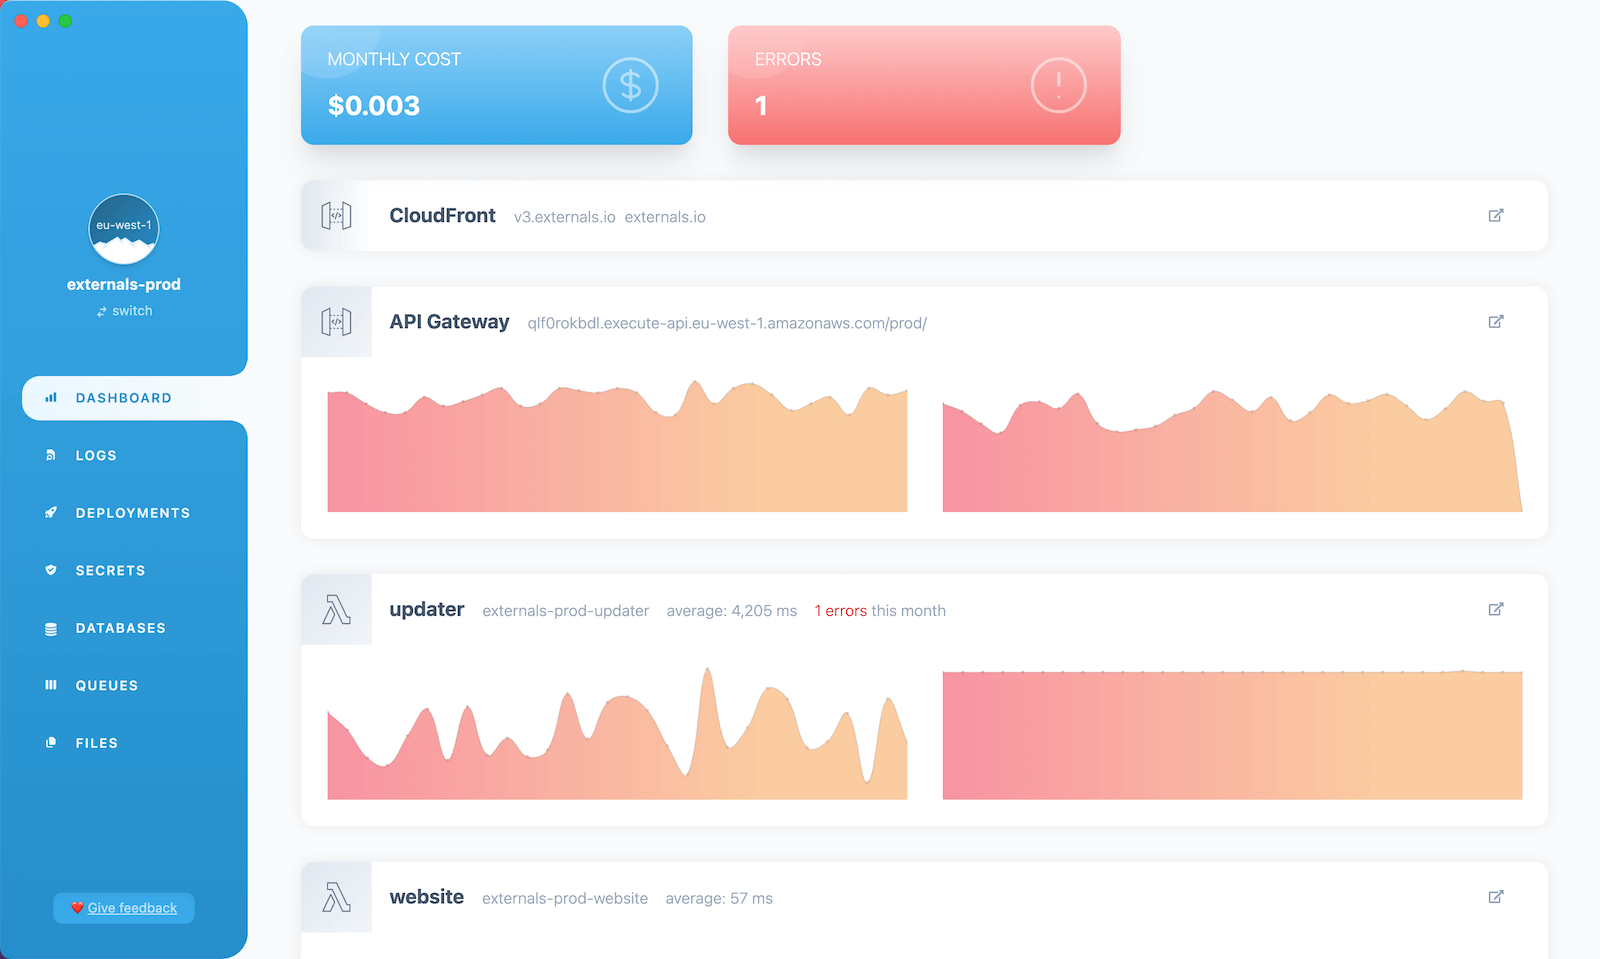
The Bref Dashboard is an alternative for projects that do not use Bref Cloud. It fetches data from AWS CloudWatch and provides a simple UI for logs and metrics. It requires no setup in AWS and can be used straight away.
Tideways
Tideways is a PHP-specific monitoring and profiling tool that can be used with Bref. It requires setting up a daemon on an EC2 instance in a VPC.