Logs
As explained in the storage documentation, the filesystem on AWS Lambda is:
- read-only, except for
/tmp - not shared between lambda instances
- not persistent
Because of that, logs should not be stored on disk.
CloudWatch
Instead of storing logs on disk, logs should be pushed to AWS CloudWatch , AWS’ service for logs.
Writing logs
By default, Bref will forward low-level PHP errors and warnings to CloudWatch.
For all other logs, your application should write logs to CloudWatch:
- With the PHP-FPM runtime for web apps: write logs to
stderr - With the runtime for event-driven functions: write logs to
stdout(usingechofor example) orstderr
AWS Lambda has a built-in mechanism to forward logs written to stderr (or stdout for event-driven functions) to CloudWatch Logs in the background, without performance impact.
Laravel
If you use Laravel, Bref will automatically configure Laravel to log to CloudWatch via stderr (LOG_CHANNEL=stderr) with the Bref\Monolog\CloudWatchFormatter formatter. You don’t have to do anything.
If you have a custom log setup (e.g. using the stack channel), you should ensure that the stderr channel is included in your stack with the Bref\Monolog\CloudWatchFormatter formatter.
With this formatter, logs will contain structured data that can be filtered in CloudWatch Logs Insights. For example, you can filter by log level or exception class.
Reading logs
Bref Cloud
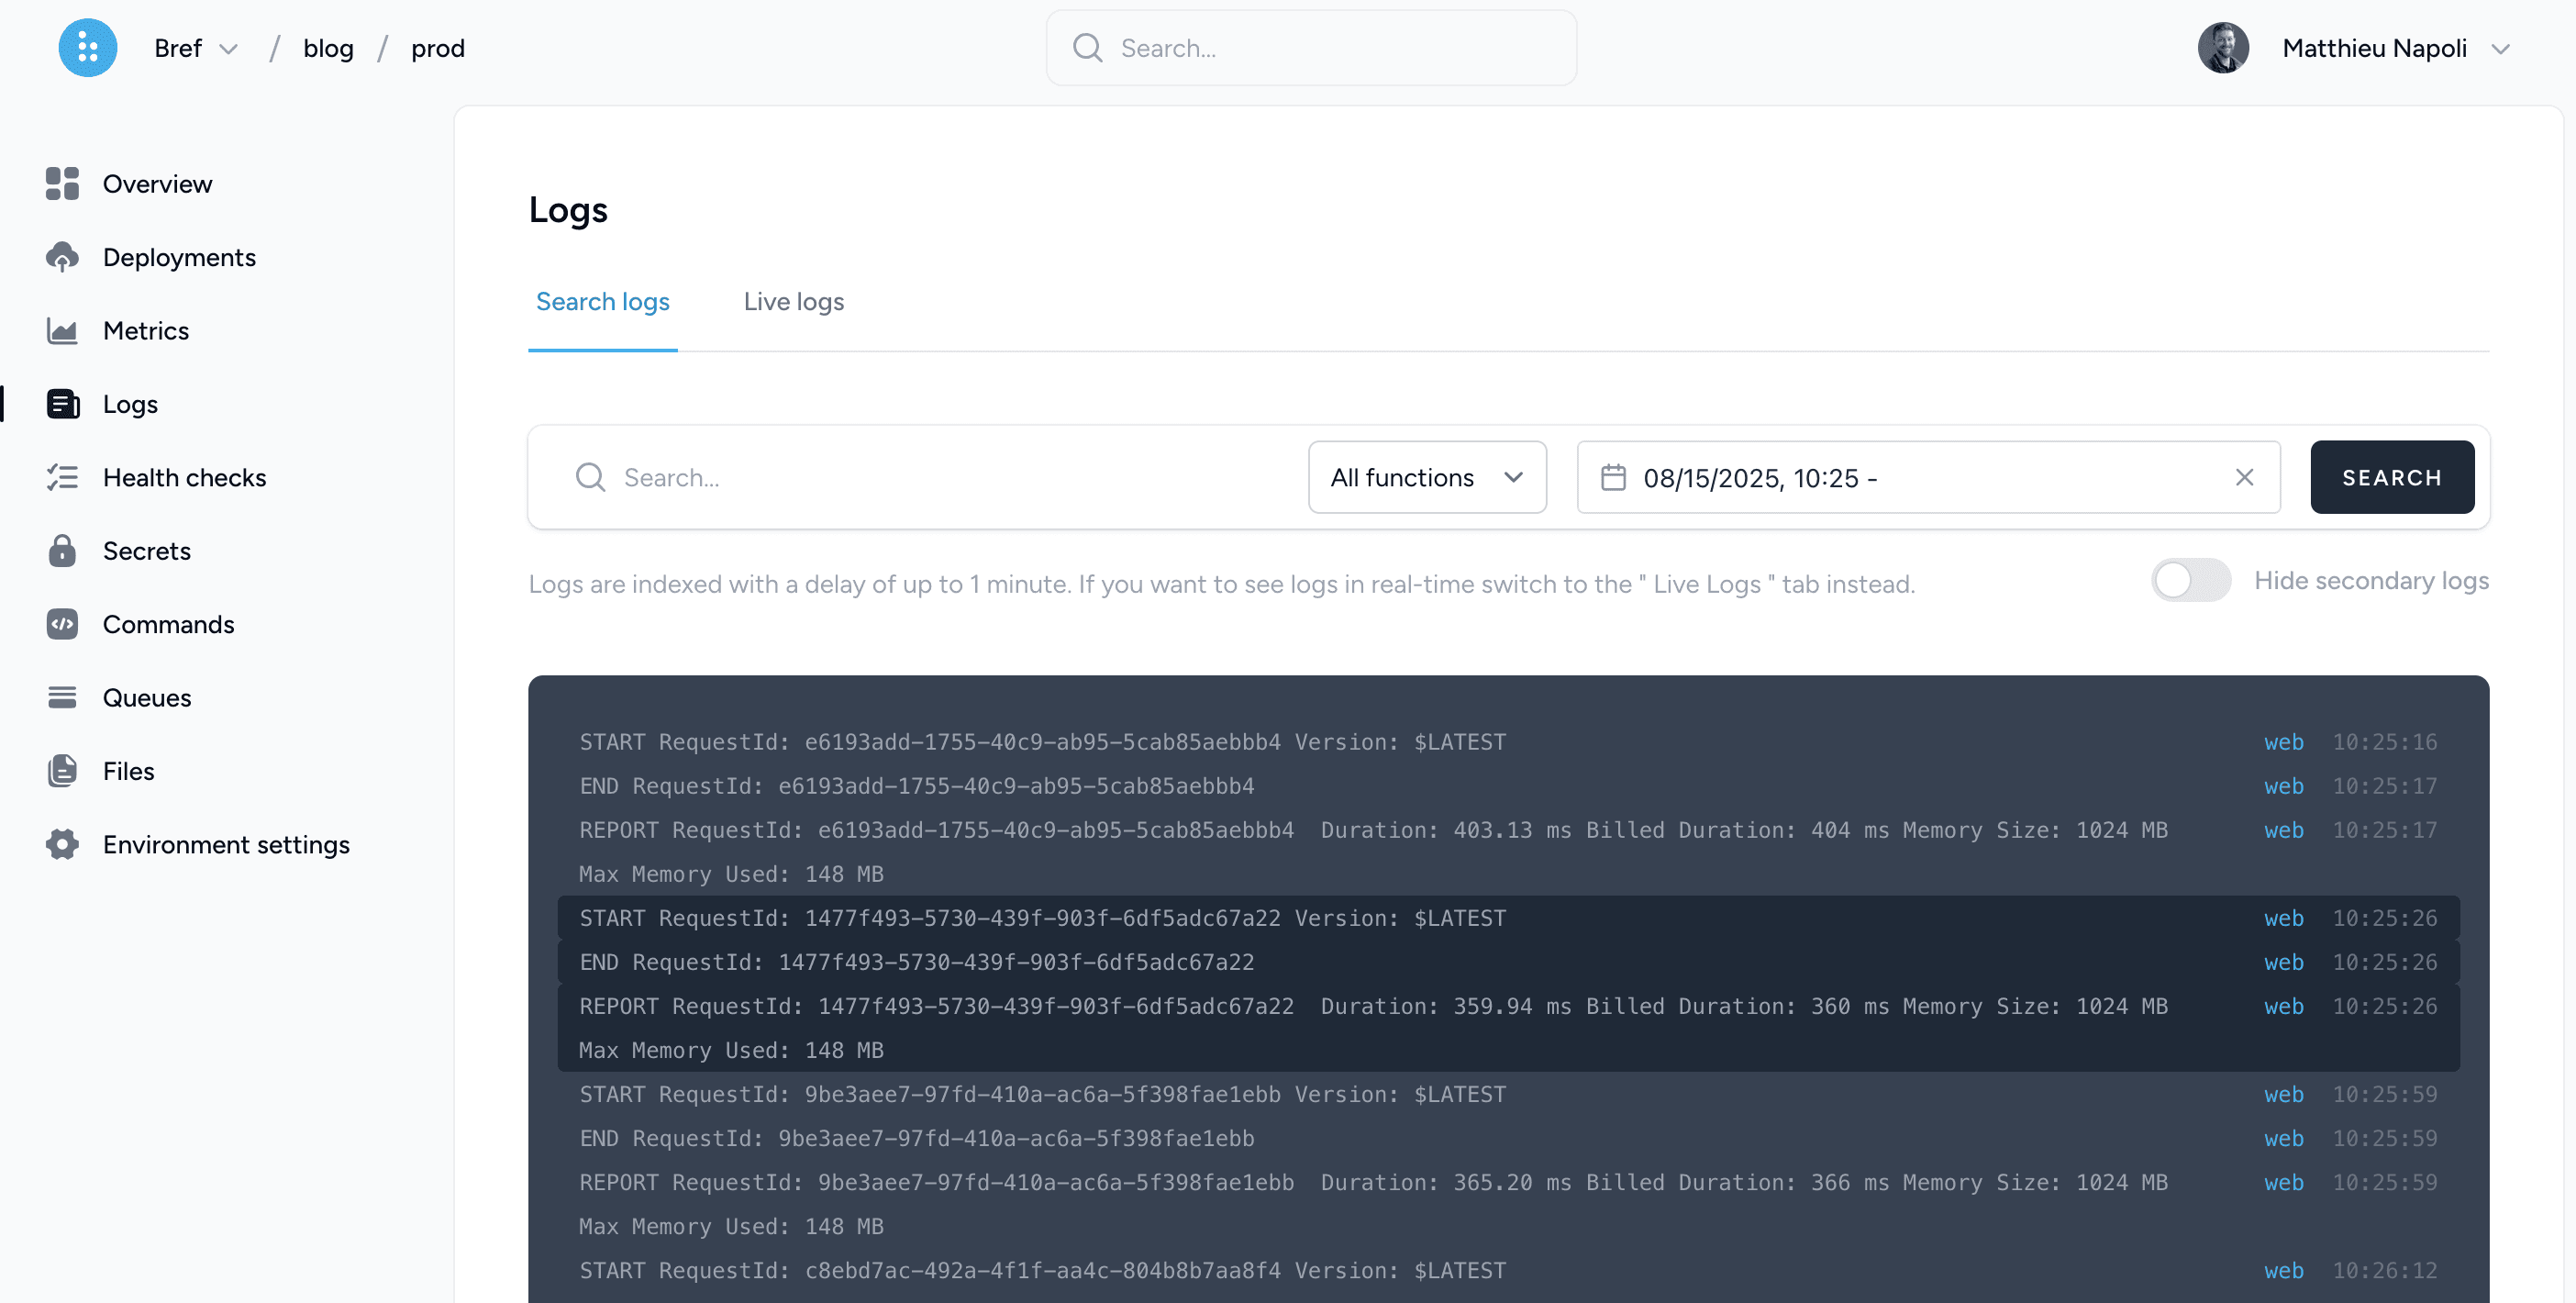
You can view, search and tail logs in the Bref Cloud dashboard:
You can also search logs from the terminal with bref logs:
# Logs of the last hour
bref logs --env=prod
# Logs of the last day of the "web" function that contain "payment" and "failed"
bref logs --env=prod --since=1d --function=web --search="payment failed"
# Between two dates (UTC), with the stack traces of exceptions
bref logs --env=prod --since="2026-09-23 14:00" --until="2026-09-23 15:00" --full
bref logs shows one line per log entry. It hides the lines that Lambda and PHP-FPM write on every invocation (START, END, REPORT…), use --all to include them.
Run bref logs --help for all the options. Add --json for machine-readable output. To use the command outside the project directory, set the application with --app and --team. bref logs is also designed for AI agents.
Logs of a single request
Every Lambda invocation (an HTTP request, a queue job, a console command…) has a request ID. Lambda writes it in its START, END and REPORT lines, and the Bref\Monolog\CloudWatchFormatter formatter starts every log line with it:
8f507cfc-8b35-4e7e-9f26-f2a3a6e7e1a2 ERROR Payment failed {"message":"Payment failed","level":"ERROR",...}Search for a request ID to see everything that happened during that invocation: the application logs, Bref’s errors (for example a timeout), and Lambda’s REPORT line with the duration and the memory used.
Bref Cloud
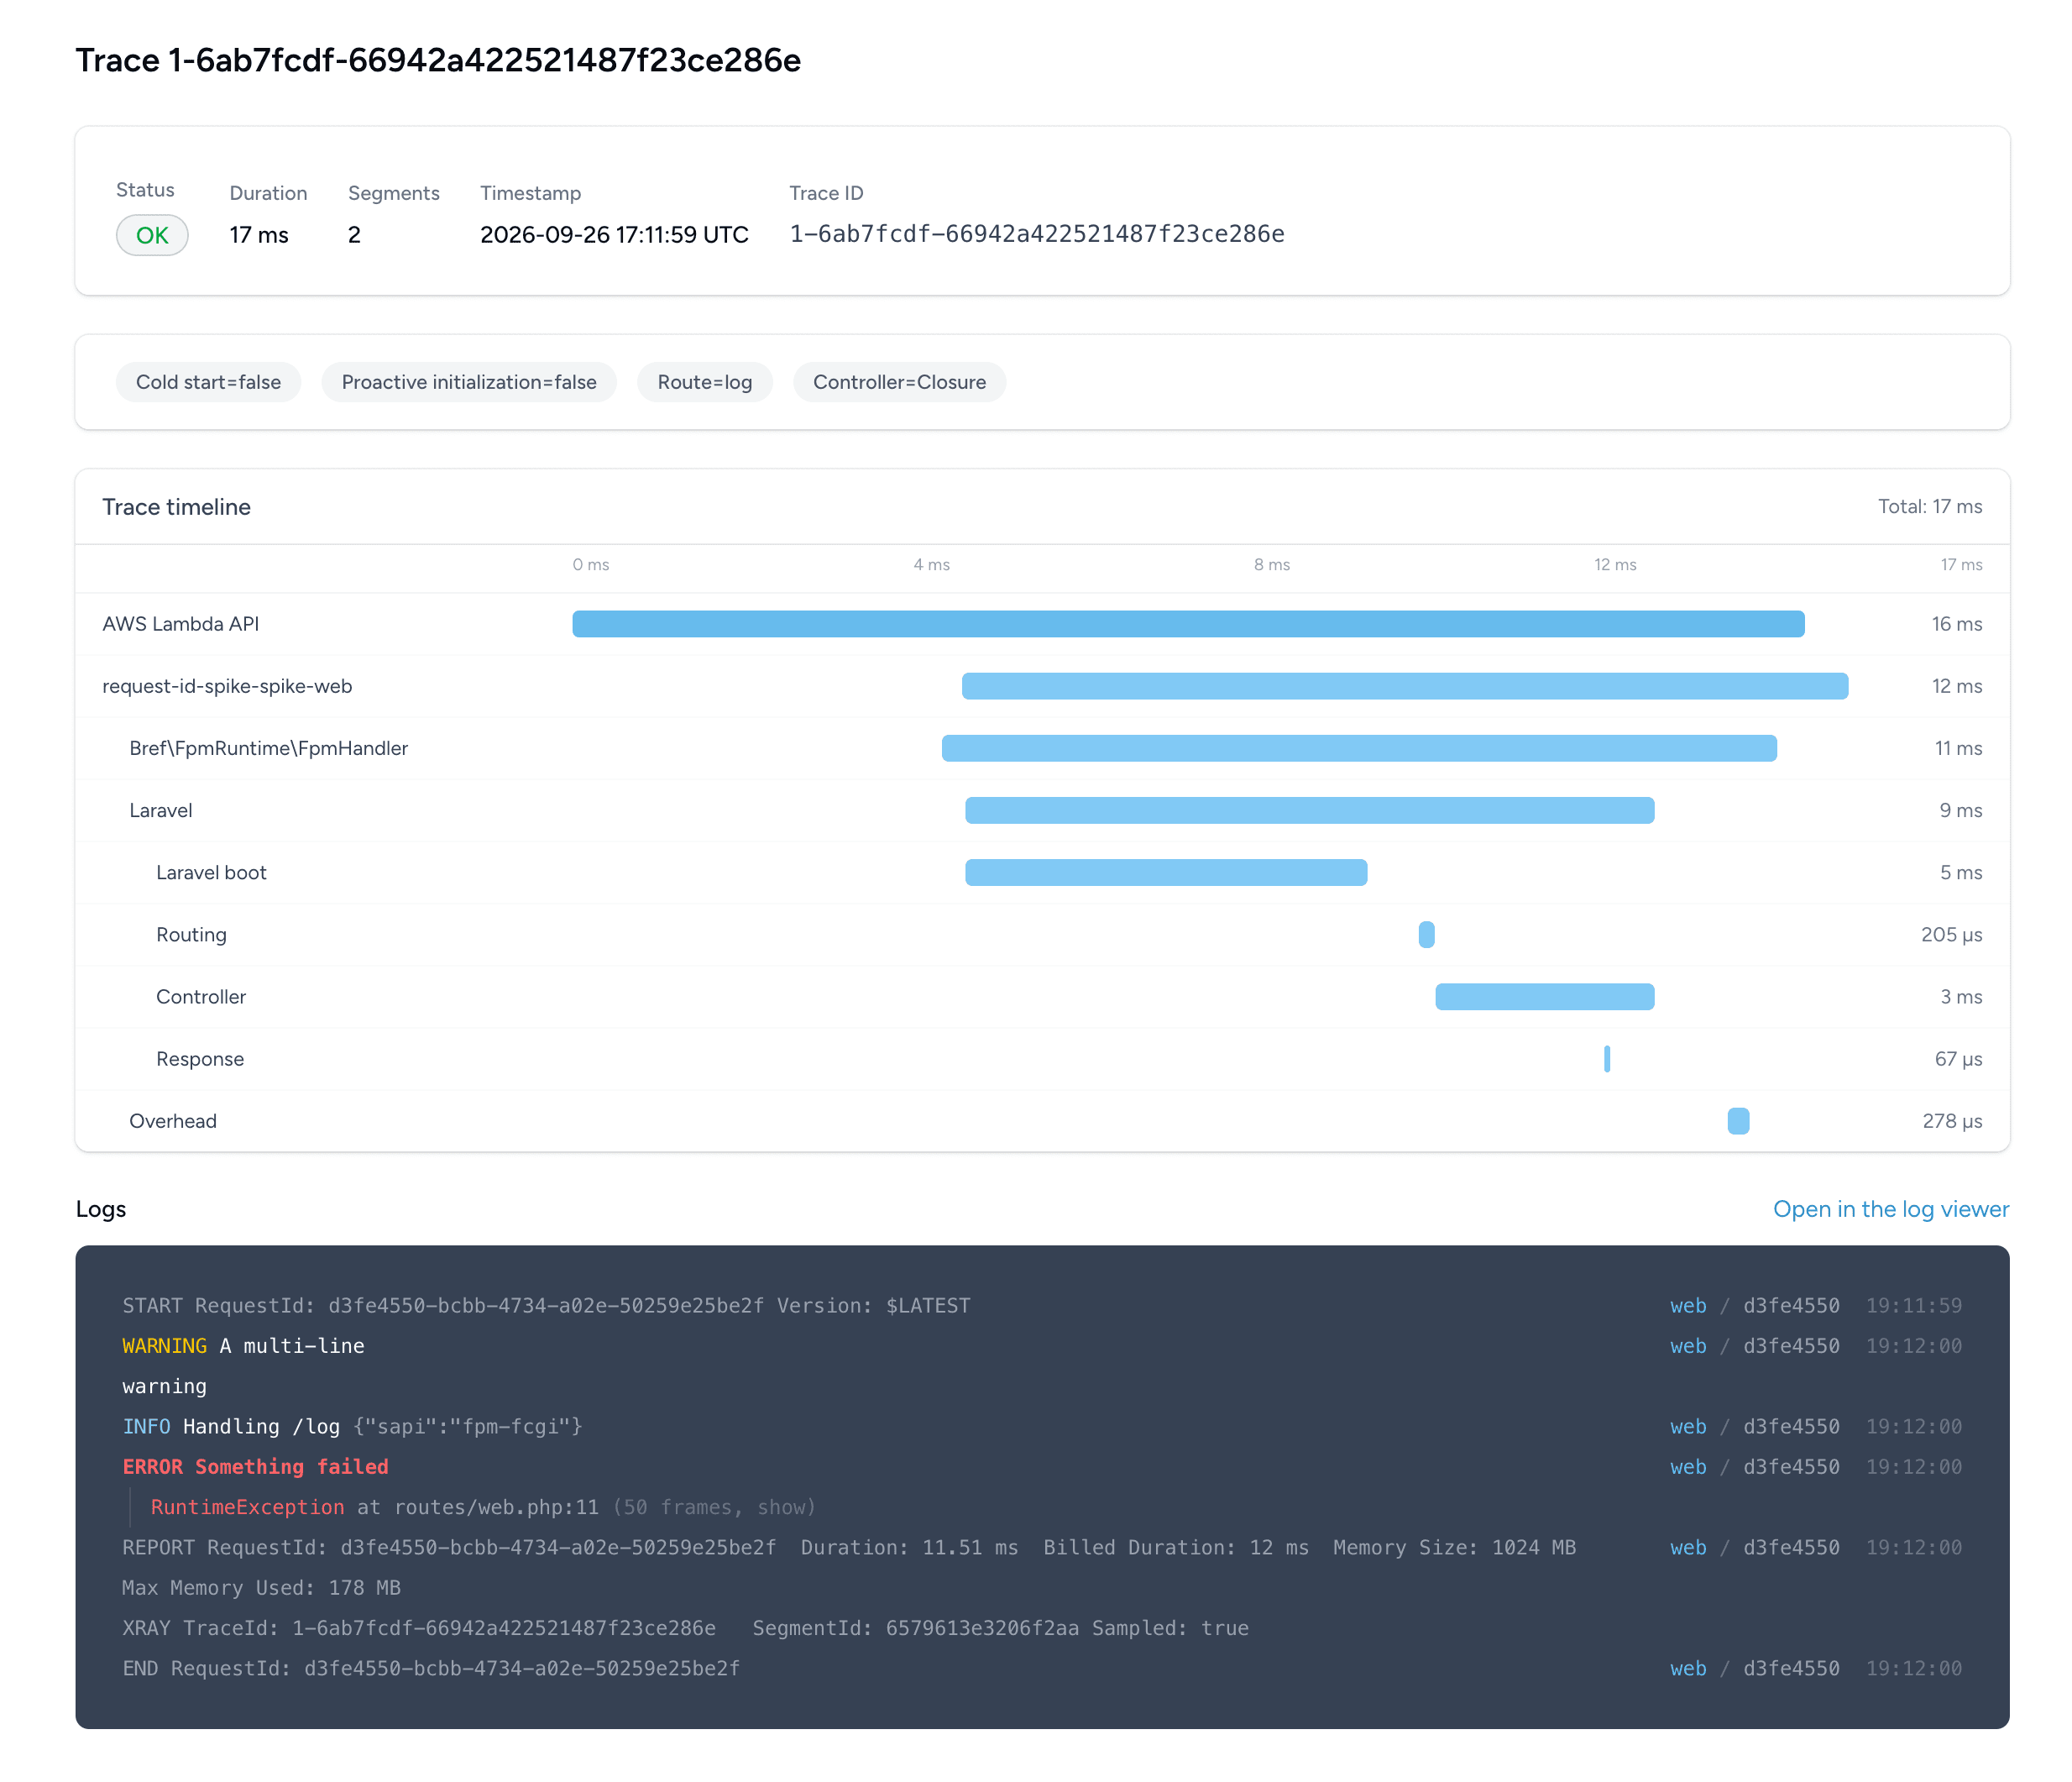
In the Bref Cloud dashboard, click the request ID next to a log line to see all the logs of that request. The X-Ray trace of a request also shows its logs:
From the terminal, search for the request ID with bref logs. Its first 8 characters are enough, like in the dashboard:
bref logs --env=prod --search=8f507cfc --allIf you use another log formatter, the request ID of the current invocation is available in $_SERVER['LAMBDA_REQUEST_ID']. For example, to add it to every Monolog record:
$logger->pushProcessor(function (Monolog\LogRecord $record) {
    $record->extra['requestId'] = $_SERVER['LAMBDA_REQUEST_ID'] ?? null;
    return $record;
});