Sentry integration - Documentation
This package provides an advanced integration between Bref applications and Sentry monitoring (opens in a new tab):
- Capture AWS Lambda errors that would otherwise be invisible: Lambda timeouts, "response too large" errors, etc. (these errors happen outside PHP-FPM workers and are not captured by the Sentry SDK by default)
- Trace cold starts in performance tracing
- Capture exceptions and trace event handlers using the function runtime (like EventBridge, SQS, S3…)
- Trace AWS SDK calls in performance tracing
Check out the documentation below for screenshots and more details.
Installation
Before getting started, make sure you have set up Sentry in your application (documentation for PHP (opens in a new tab), for Laravel (opens in a new tab) or for Symfony (opens in a new tab)). The Bref integration will add features on top of the Sentry SDK.
When configuring Sentry, you can set the Sentry "DSN" in a .env file (if you framework supports it) or in an environment variable in serverless.yml.
1. Enable Packagist.com
The bref/sentry-integration package is distributed via Packagist.com (opens in a new tab), the alternative to Packagist.org (opens in a new tab) for private packages (provided by the Composer team). To install the package, you will need:
- a Packagist.com token
- a Packagist.com sub-repository URL
You will receive both after purchasing a license on the Bref website.
Once you have your license, enable Packagist.com in your composer.json by adding the sub-repository URL:
{
    "repositories": [
        {"type": "composer", "url": "https://bref.repo.packagist.com/<your-org-name>/"}
    ]
}Make sure to replace the URL with the one provided with the license you purchased.
Next, configure the Packagist.com token (provided with the license you purchased).
-
On developer machines, you can run the following command:
composer config --global --auth http-basic.bref.repo.packagist.com token <your-token> -
In CI/CD environments, you can set the
COMPOSER_AUTHenvironment variable:COMPOSER_AUTH='{"http-basic": {"bref.repo.packagist.com": {"username": "token", "password": "<token-here>"}}}'
The token is for your whole organization, you can share it with your team.
2. Install the package
You can now install the package via Composer:
composer require bref/sentry-integrationIf you use Laravel, the Laravel integration will be automatically set up via a service provider.
If you use Symfony, you will need to manually register the bundle in config/bundles.php:
return [
    // ...
    Bref\Sentry\Symfony\BrefSentryBundle::class => ['all' => true],
];
If you don't use Laravel or Symfony, the package provides a PSR-15 middleware you can add to your application. Add the Bref\Sentry\Psr15\BrefSentryMiddleware middleware to your middleware stack.
Troubleshooting
Send me a Slack message or an email (matthieu@bref.sh) if you have any trouble, I can help you set it up!
Usage
Event-driven PHP runtime
When using the event-driven function runtime, event handlers will be automatically traced in Sentry:
- Exceptions will be captured and reported to Sentry
- Event handlers will be traced in performance tracing
This is done automatically and will work for all event handlers, for example EventBridge, SQS, S3, SNS, etc.
Here is an example of an EventBridge invocation captured in performance tracing:
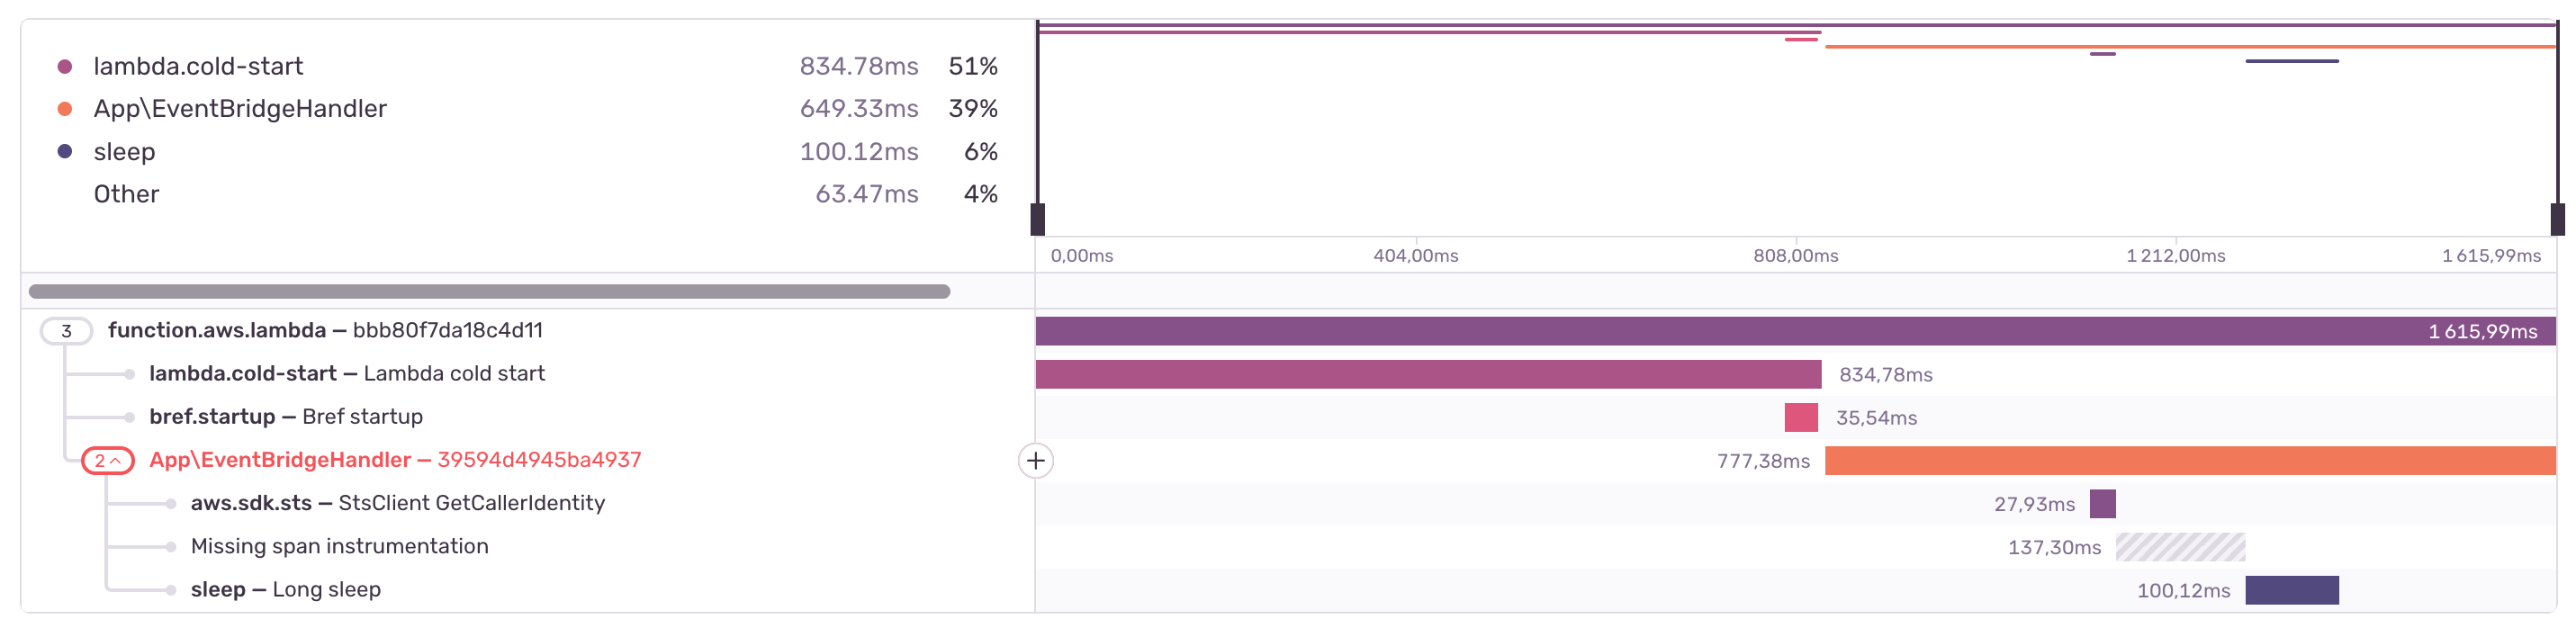
Advanced metadata and tags will also be captured on each transaction, allowing to better debug any issue. For example:

Cold starts tracing
Cold starts are automatically traced when using Laravel or Symfony, there is nothing additional to set up.
Cold starts will appear in transactions in Sentry performance tracing (named lambda.cold-start), along with a sub-span for the Bref initialization (bref.startup). For example:
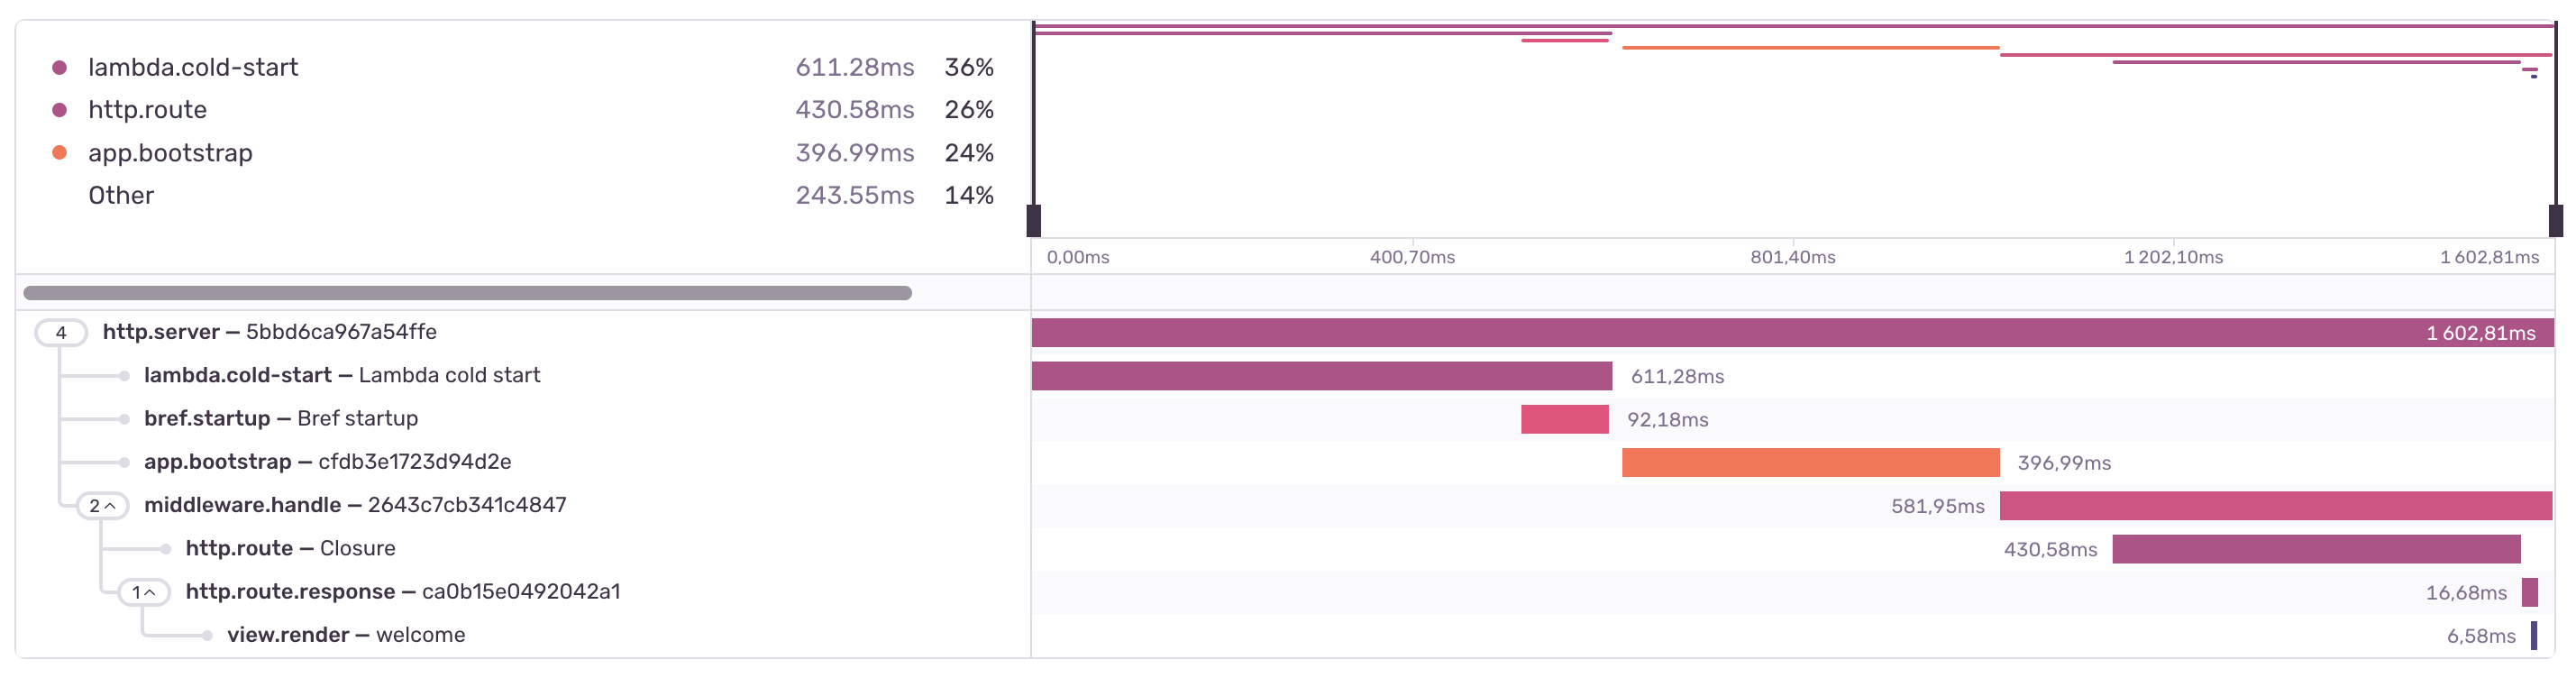
Note: because of technical limitation, the cold start span doesn't include the exact total time it takes for the AWS Lambda instance to boot (a few hundred milliseconds are missing).
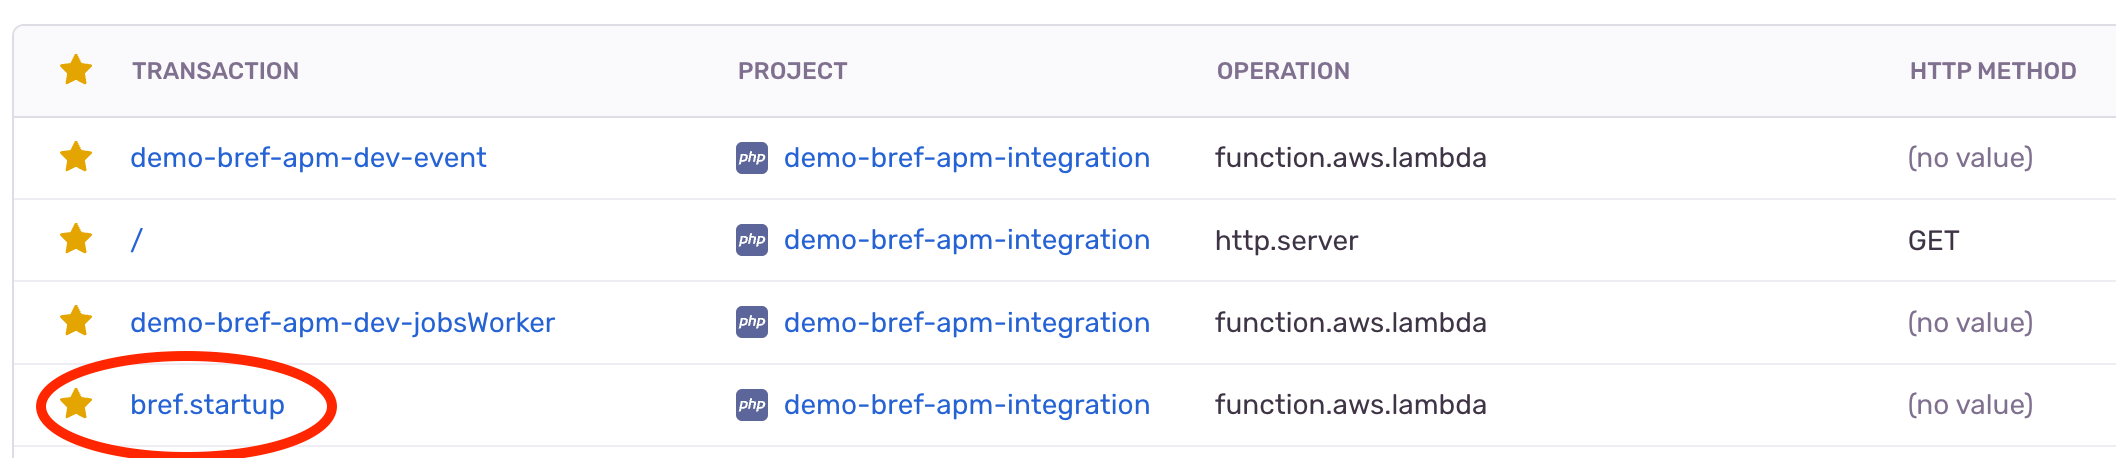
Bref startup tracing
When using the event-driven PHP runtime, Bref might restart the PHP process between invocations (when not using BREF_LOOP_MAX). This is not a full Lambda cold start, but a Bref process restart. This is traced in Sentry (bref.startup), however it is not part of the main transaction. Indeed, the restart happens after the Lambda invocation has completed, so it is not part of the HTTP response time.
This is why it is tracked as a separate "sub-transaction" in Sentry, named bref.startup:
Since it is a child of the main transaction, they are part of the same distributed trace and can be viewed together:

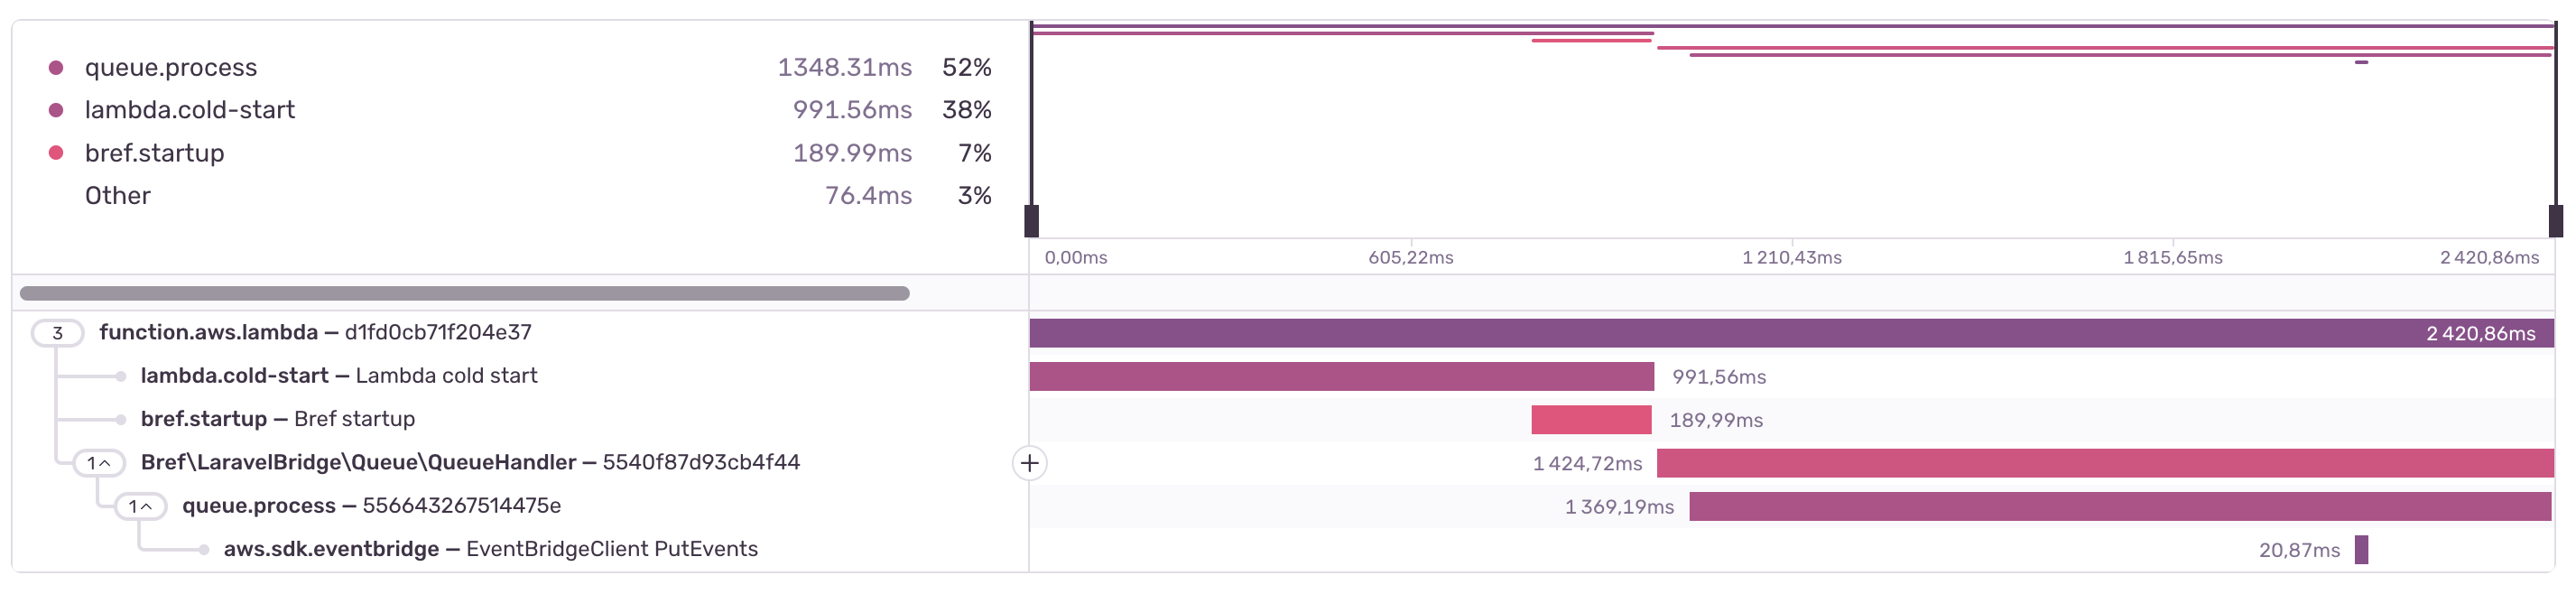
Tracing AWS SDK calls
You can trace AWS SDK calls in Sentry performance tracing. This is useful to see which calls are slow and might be the cause of performance issues.
Trace AWS SDK calls by calling AwsSdkTracer::trace($client) after creating an AWS SDK client. For example:
use Aws\EventBridge\EventBridgeClient;
use Bref\Sentry\AwsSdk\AwsSdkTracer;

$client = new EventBridgeClient([
    // ...
]);
AwsSdkTracer::trace($client);
This will add a span to the current transaction for each AWS SDK call. Here is an example where a SQS job handler sends a message to EventBridge: