X-Ray integration - Documentation
This package provides an advanced integration between Bref applications and AWS X-Ray monitoring .
Check out the documentation below for screenshots and more details. View the changelog for the latest updates and releases.
Bref Cloud users get a free X-Ray license included in their plan. You can view traces directly in the Bref Cloud dashboard. To activate your free license, contact support via bref.cloud/support or Slack .
Installation
1. Enable Packagist.com
The bref/xray-integration package is distributed via Packagist.com , the alternative to Packagist.org for private packages (provided by the Composer team). To install the package, you will need:
- a Packagist.com token
- a Packagist.com sub-repository URL
You will receive both after purchasing a license on the Bref website.
Once you have your license, enable Packagist.com in your composer.json by adding the sub-repository URL:
{
    "repositories": [
        {"type": "composer", "url": "https://bref.repo.packagist.com/<your-org-name>/"}
    ]
}
Make sure to replace the URL with the one provided with the license you purchased.
Next, configure the Packagist.com token (provided with the license you purchased).
-
On developer machines, you can run the following command:
composer config --global --auth http-basic.bref.repo.packagist.com token <your-token> -
In CI/CD environments, you can set the
COMPOSER_AUTHenvironment variable:COMPOSER_AUTH='{"http-basic": {"bref.repo.packagist.com": {"username": "token", "password": "<token-here>"}}}'
The token is for your whole organization, you can share it with your team.
2. Install the package
You can now install the package via Composer:
composer require bref/xray-integration -WEnable X-Ray tracing in your serverless.yml file:
provider:
    # ...
    tracing:
        lambda: true
        apiGateway: true # enable if you are using API Gateway
    iam:
        role:
            managedPolicies:
                - arn:aws:iam::aws:policy/AWSXRayDaemonWriteAccess
If you use Laravel, the Laravel integration will be automatically set up via a service provider.
If you use Symfony, you will need to manually register the bundle in config/bundles.php:
return [
    // ...
    Bref\Apm\XRay\Symfony\BrefXrayBundle::class => ['all' => true],
];
Troubleshooting
Send me a Slack message or an email (matthieu@bref.sh) if you have any trouble, I can help you set it up!
Enabling AWS Transaction Search
AWS Transaction Search is an AWS service that indexes X-Ray traces and replaces “X-Ray classic” search. It is opt-in, and we recommend enabling it, whether you explore traces in Bref Cloud or in the AWS console:
- search up to 30 days of traces instead of only 6 hours
- filter traces by route, job, command, cold start, or any custom annotation
- spans are stored in CloudWatch Logs (the
aws/spanslog group), so you can also query them with CloudWatch Logs Insights, for example to aggregate durations by route or by SQL query
In Bref Cloud, Transaction Search also unlocks the Performance page: slowest database queries, latency per route, slowest jobs.
If you don’t use Bref Cloud, explore traces from the Transaction Search page of the CloudWatch console. The classic X-Ray console keeps working but only sees the indexed percentage (see below).
Downsides:
- Classic X-Ray traces load fast, while Transaction Search can take a few seconds.
- Transaction Search is enabled for the whole region. Check whether another team or tool depends on classic X-Ray.
The change is reversible. To enable Transaction Search (official guide ):
-
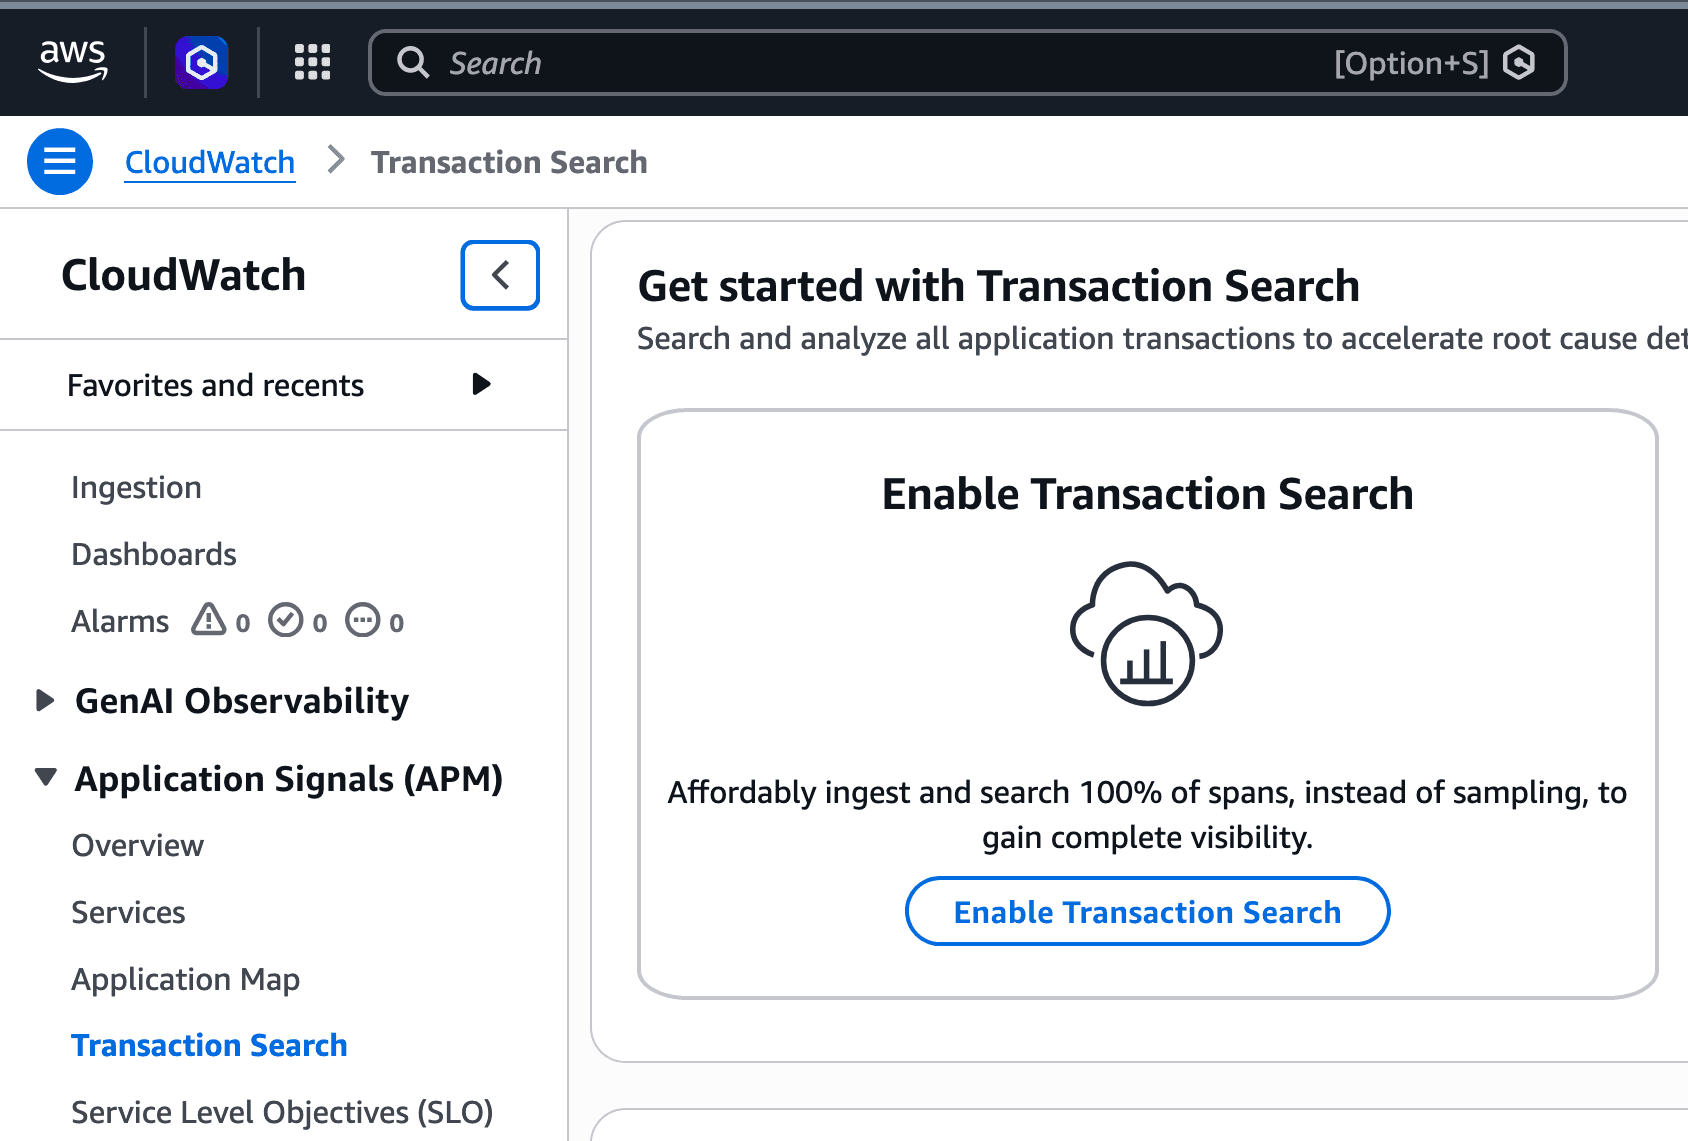
Open CloudWatch in the right region.
-
Go to Transaction Search and click Enable Transaction Search.
-
Check the box and click Save.
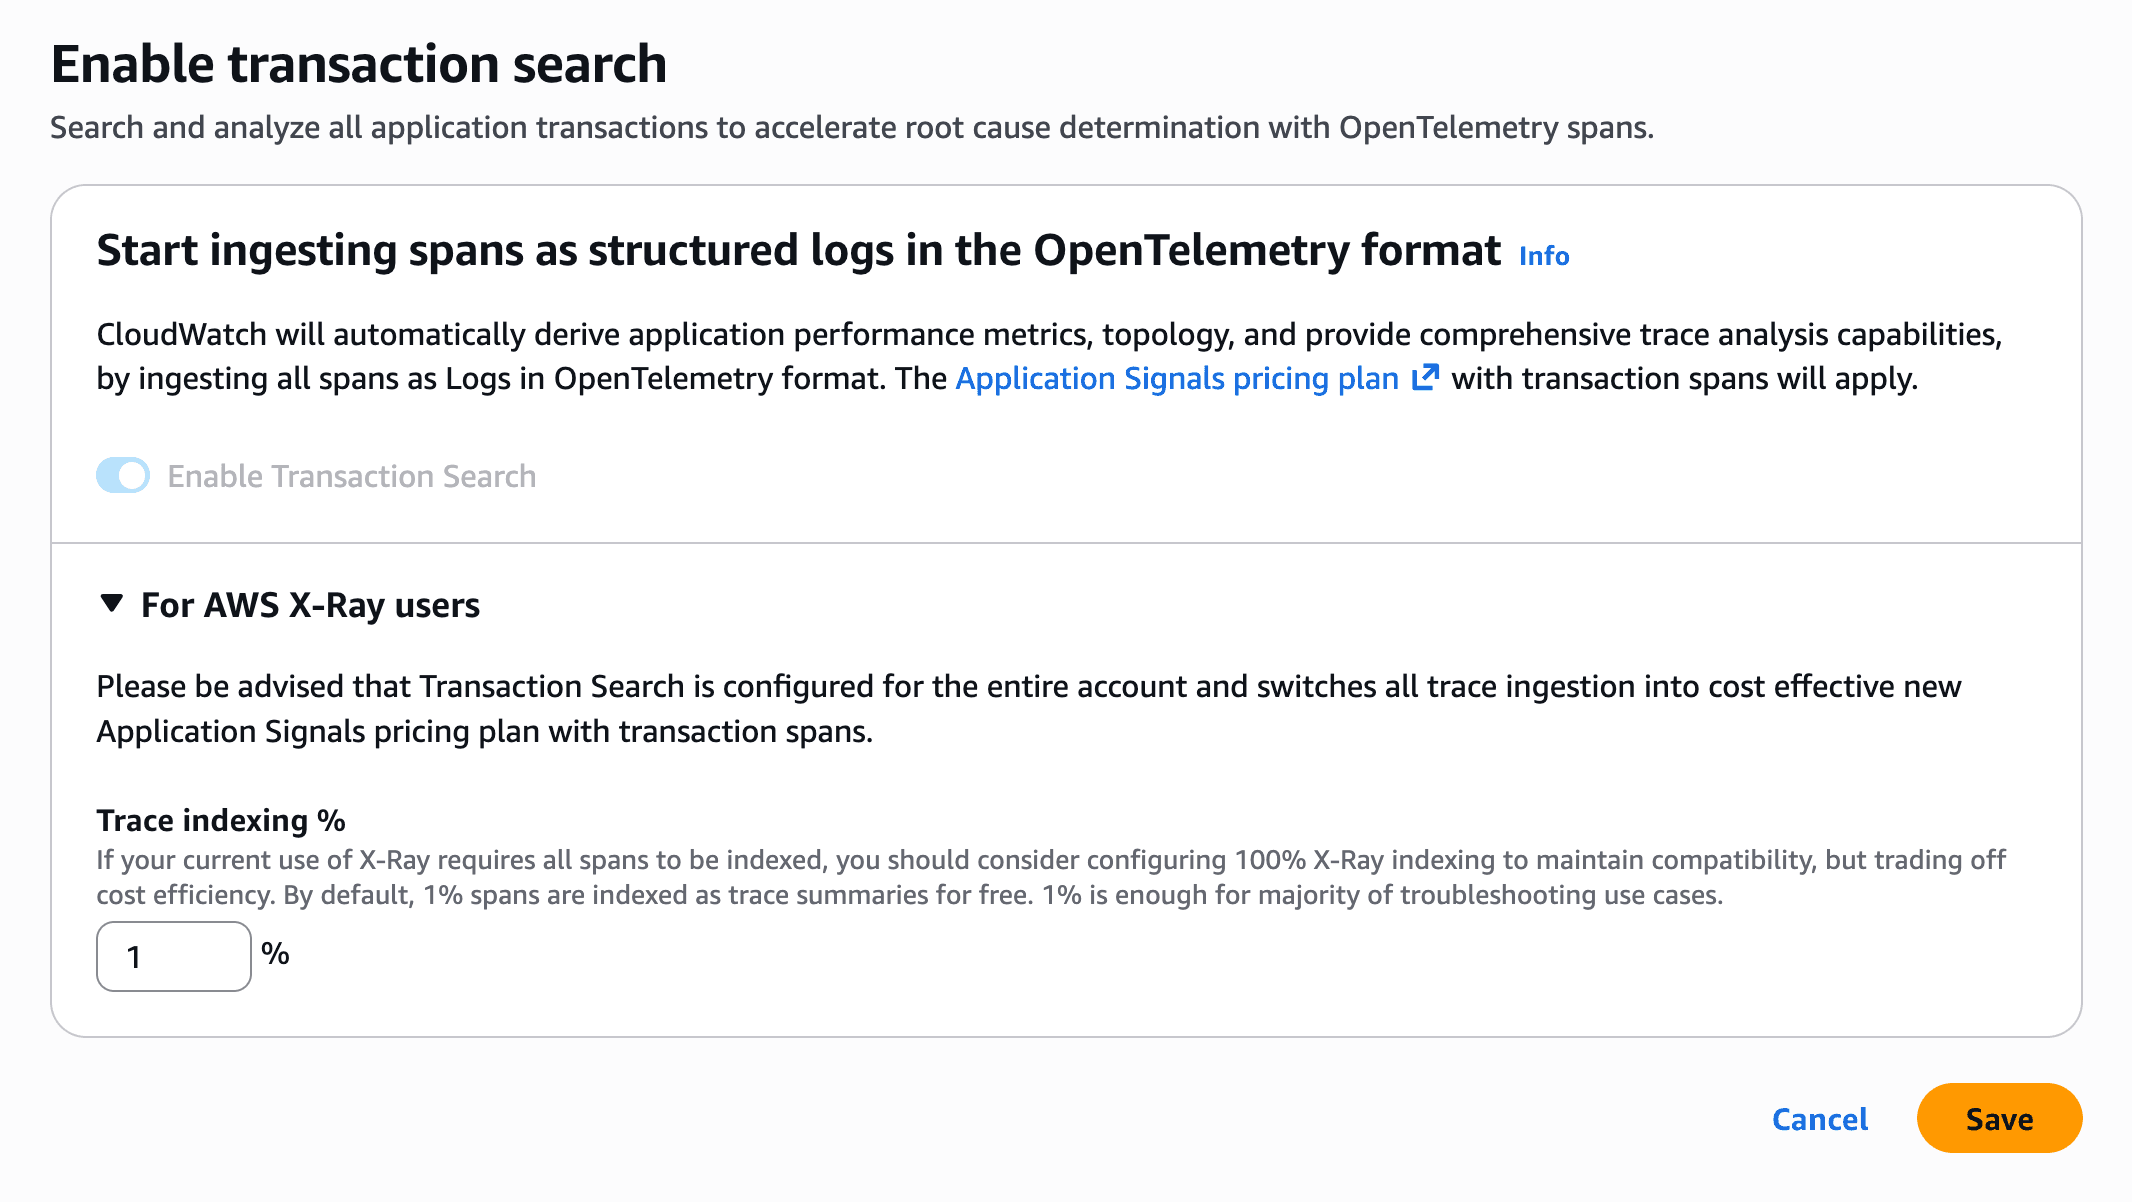
Leave the indexing percentage at 1% unless you know what you are doing. It only affects the classic X-Ray console and APIs. It is not the Lambda sampling rate (see Costs), and it has no effect on Bref Cloud or on the Transaction Search page.
It can take up to 10 minutes to activate Transaction Search and see spans show up, in Bref Cloud or in the CloudWatch console.
Costs
AWS X-Ray is a paid service. You can find the pricing details on the AWS CloudWatch pricing page .
- Classic X-Ray: $5 per million traces (100k free per month).
- Transaction Search: $0.35/GB of trace data stored → roughly $5 per million traces for a typical PHP app (though it depends on the size of each trace).
One trace is one Lambda invocation, i.e. one request or one job. X-Ray applies a sampling rate out of the box, so you will not be charged for all traces:
The sampling rate is 1 request per second and 5 percent of additional requests.
That sampling applies to X-Ray classic and Transaction Search, no difference.
This is quite useful: when an application has low traffic, most requests/invocations will be traced. However, when traffic ramps up, X-Ray costs don’t scale linearly with traffic because only a percentage of requests will be traced. Enabling X-Ray in dev and staging environments can also be a great way to debug and troubleshoot issues with almost no costs.
Usage
Laravel
If you are using Laravel, the package automatically integrates with the Laravel service provider. You can see the traces in Bref Cloud or in the AWS console.
Request tracing
The package automatically traces all requests to your application.
Database queries
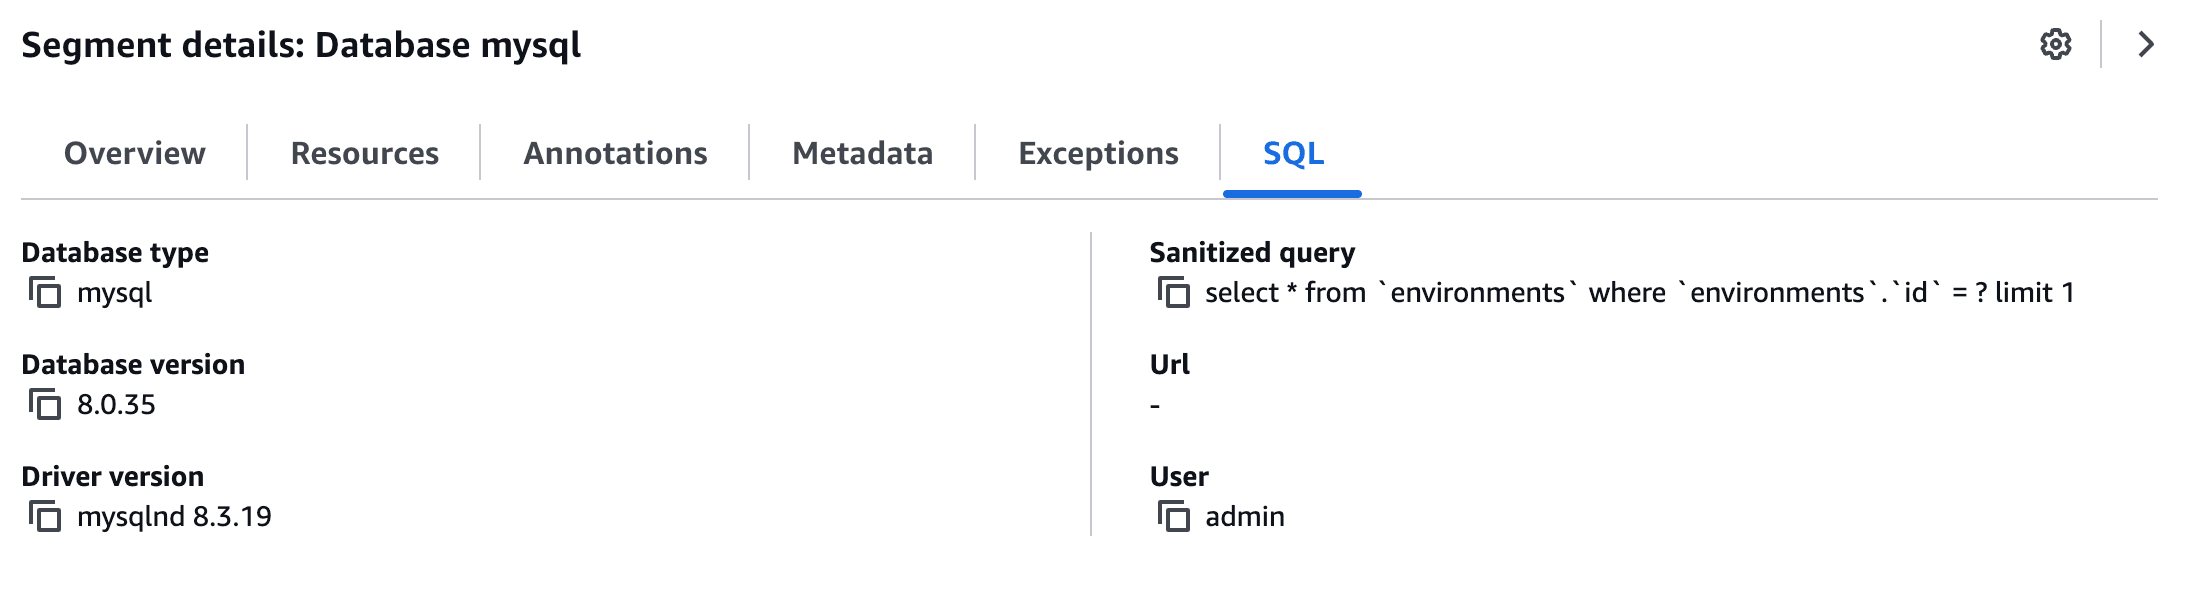
Eloquent queries are automatically traced and the SQL queries are added to metadata.
Jobs
The package automatically traces all jobs dispatched via the Laravel queue. Traces can be filtered by job name.
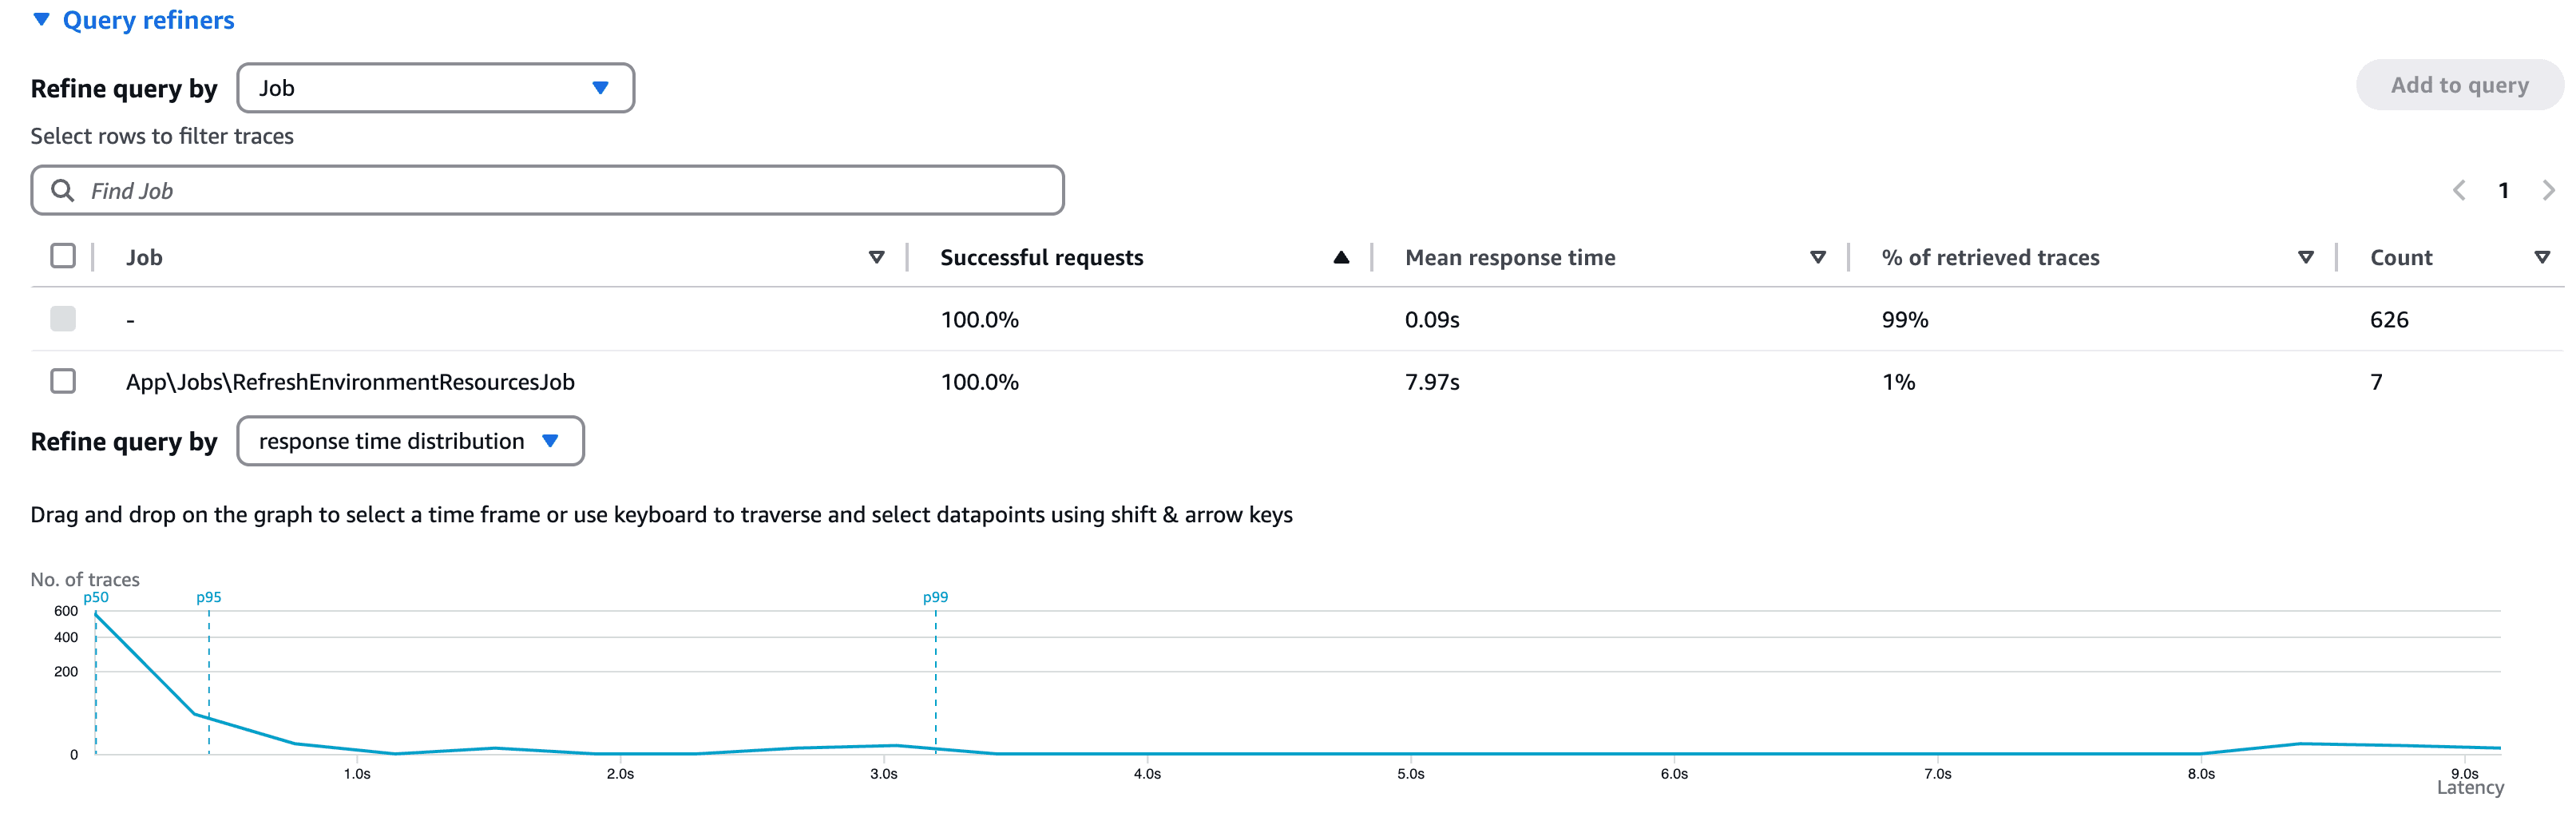
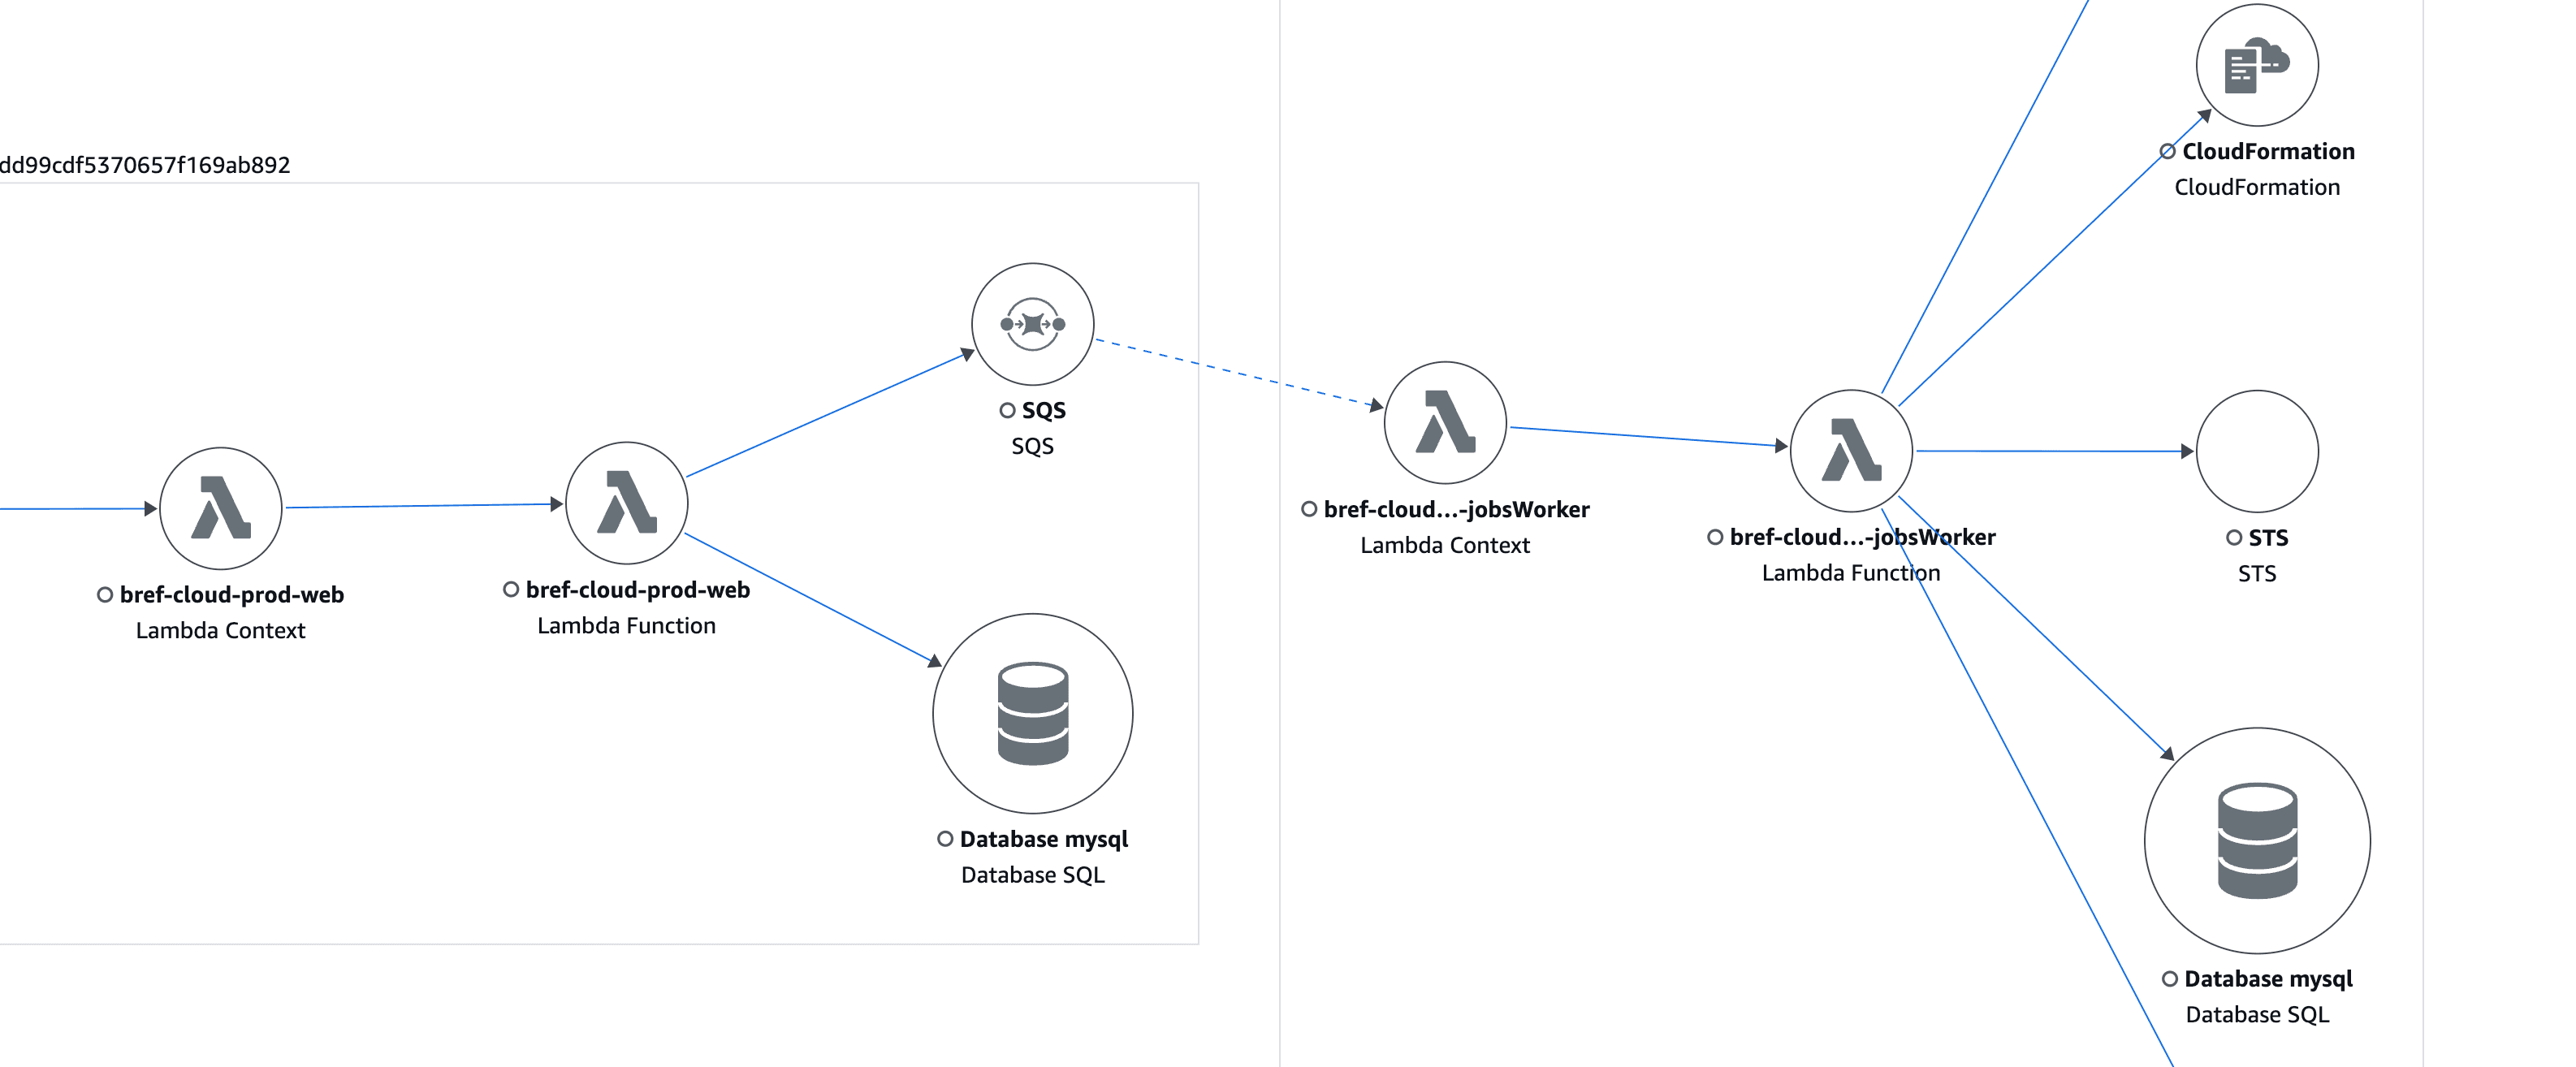
The integration will also forward X-Ray trace IDs correctly so that distributed tracing works correctly. For example, if a job is dispatched from a Lambda function that is already traced, the job will be traced as well.
HTTP client
The package automatically traces all HTTP requests made via the Laravel HTTP client.
Symfony
If you are using Symfony, the package automatically integrates with the Symfony service provider. You can see the traces in Bref Cloud or in the AWS console.
Symfony Messenger
To trace Symfony Messenger jobs across multiple services, you need to trace the AWS SDK client used by Symfony Messenger:
    bref.messenger.sns_client:
        class: AsyncAws\Sns\SnsClient
        public: true
        arguments:
            $httpClient: '@Bref\Apm\XRay\AsyncAws\TracedAsyncAwsHttpClient'

    bref.messenger.eventbridge_client:
        class: AsyncAws\EventBridge\EventBridgeClient
        public: true
        arguments:
            $httpClient: '@Bref\Apm\XRay\AsyncAws\TracedAsyncAwsHttpClient'
Alternatively, you can also install async-aws/async-aws-bundle and apply the following configuration to config/packages/async_aws.yaml:
async_aws:
    http_client: 'Bref\Apm\XRay\AsyncAws\TracedAsyncAwsHttpClient'
While the configuration above works for SNS and EventBridge, it is unfortunately not as simple for SQS. The SQS client is created inside a Symfony Messenger class (AmazonSqsTransportFactory) in a non-extensible way. To work around that, you can create a custom transport factory that overrides the native one from Symfony Messenger and make it use the TracedAsyncAwsHttpClient from Bref. Here is an example of class you can create in your Symfony application:
<?php declare(strict_types=1);

namespace App;

use Bref\Apm\XRay\AsyncAws\TracedAsyncAwsHttpClient;
use Psr\Log\LoggerInterface;
use Symfony\Component\Messenger\Bridge\AmazonSqs\Transport\AmazonSqsTransport;
use Symfony\Component\Messenger\Bridge\AmazonSqs\Transport\Connection;
use Symfony\Component\Messenger\Transport\Serialization\SerializerInterface;
use Symfony\Component\Messenger\Transport\TransportFactoryInterface;
use Symfony\Component\Messenger\Transport\TransportInterface;

class AmazonSqsTransportFactory implements TransportFactoryInterface
{
    public function __construct(
        private ?LoggerInterface $logger = null,
    ) {
    }

    public function createTransport(#[\SensitiveParameter] string $dsn, array $options, SerializerInterface $serializer): TransportInterface
    {
        unset($options['transport_name']);

        return new AmazonSqsTransport(Connection::fromDsn($dsn, $options, new TracedAsyncAwsHttpClient, $this->logger), $serializer);
    }

    public function supports(#[\SensitiveParameter] string $dsn, array $options): bool
    {
        return str_starts_with($dsn, 'sqs://') || preg_match('#^https://sqs\.[\w\-]+\.amazonaws\.com/.+#', $dsn);
    }
}
Cold starts tracing
Cold starts are automatically traced when using Laravel or Symfony. There is nothing additional to set up.
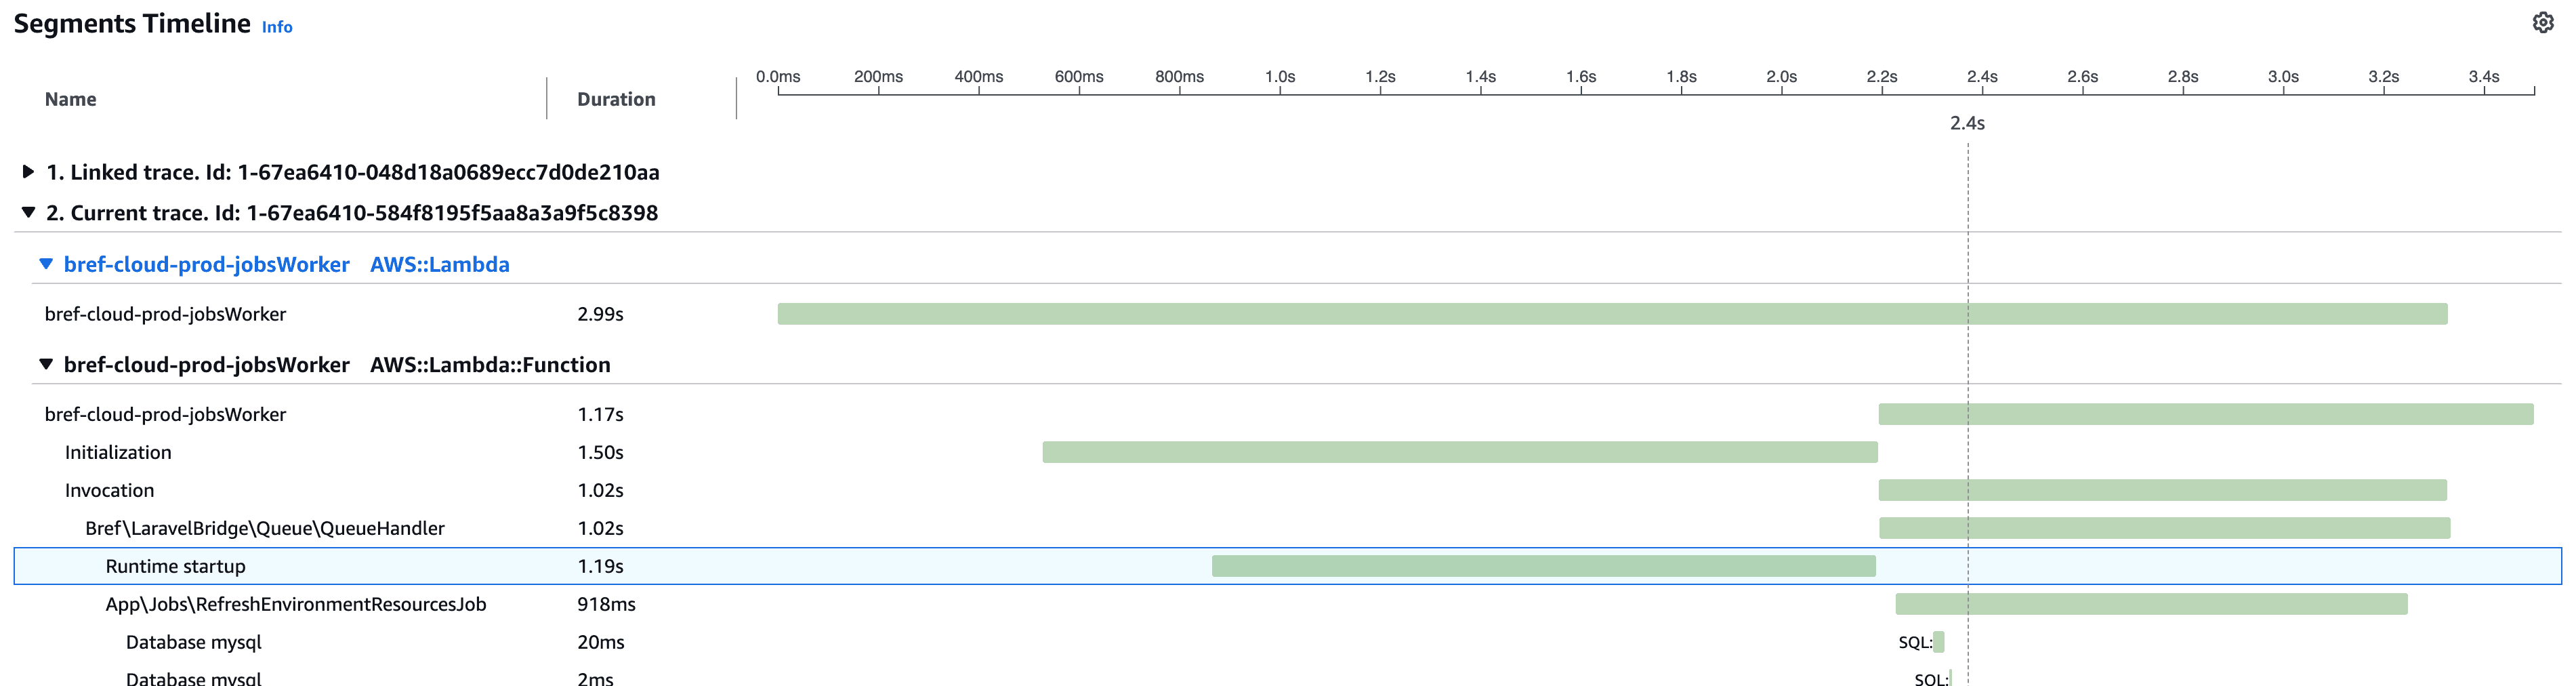
In the example below, we can see the “Initialization” segment corresponding to the whole time it takes for AWS Lambda to initialize the instance. Part of that is the “Runtime startup” segment, which is the time it takes for the Bref runtime to start up.
On top of tracing cold starts, Bref will report (via annotations) whether an invocation included a user-facing cold start:

Sometimes, Lambda will start AWS Lambda instances proactively, this is called proactive initiation . This is an AWS Lambda cold start, but it is not visible to users because the cold start happens asynchronously, before the Lambda instance is used at all. This is why Bref separates:
- user-facing cold starts (cold starts that happened during an invocation)
- proactive initializations (cold starts that happened outside an invocation)
Proactive initializations are also annotated by Bref:

X-Ray does not handle proactive invocations well: it includes the initialization time and the duration when Lambda was not used in a trace. As such, it is possible to see Lambda invocations with a duration of several minutes. This in an AWS X-Ray bug/limitation, Bref unfortunately cannot do anything about it. This is why Bref annotates proactive invocations, so that you can spot them in X-Ray.
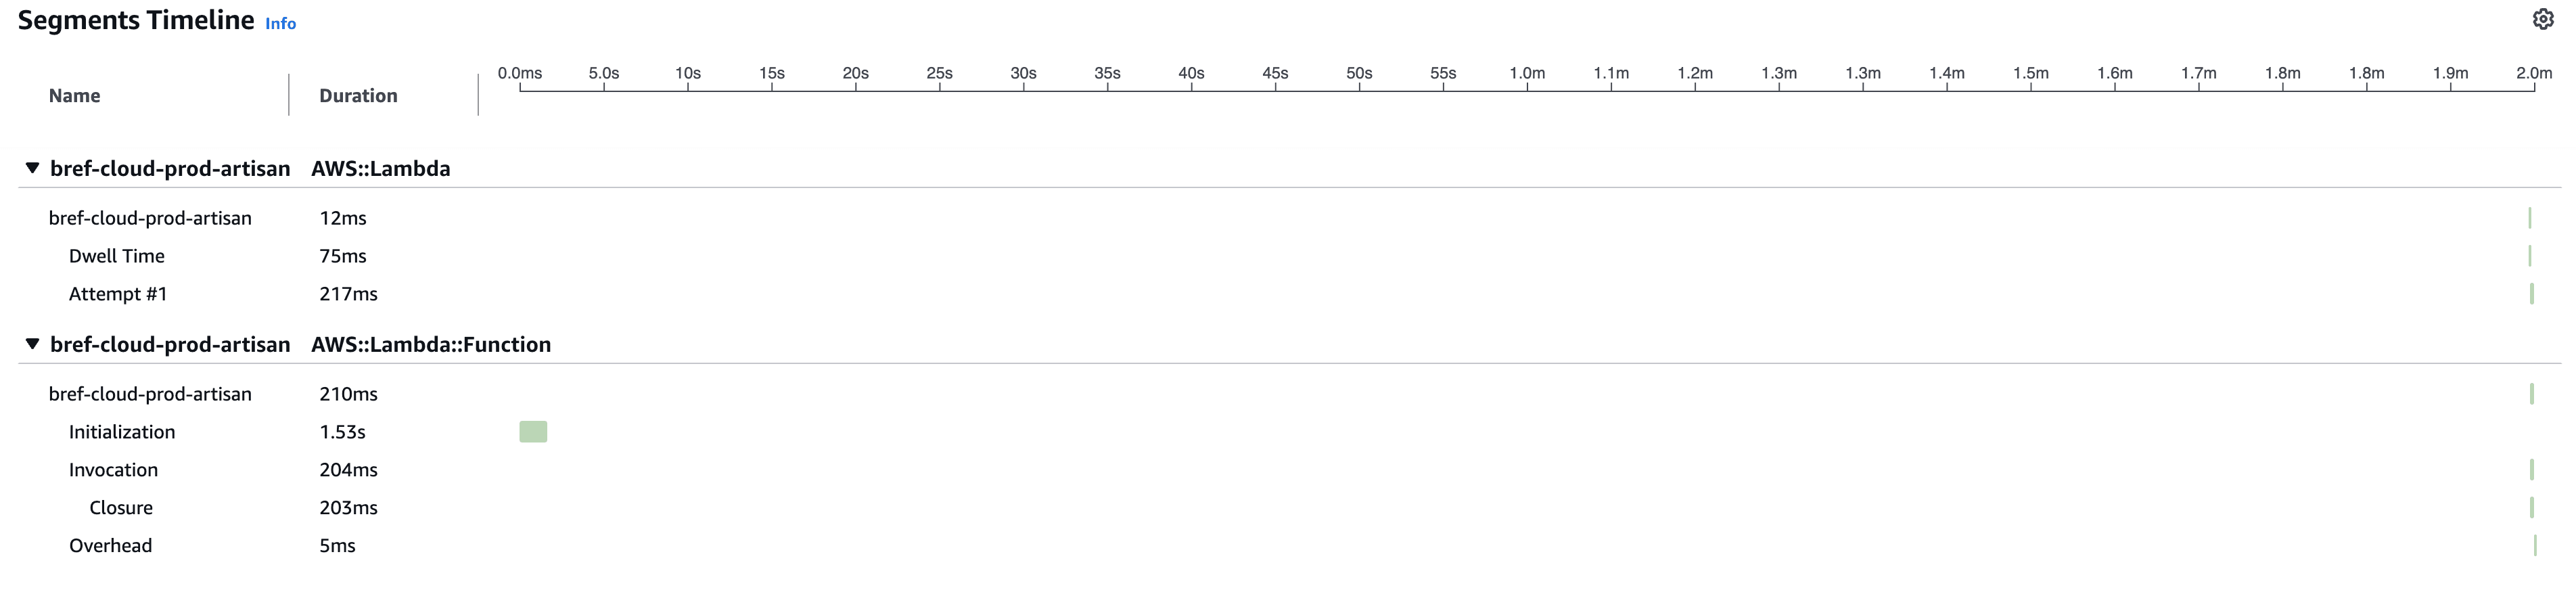
Here is an example: the Lambda instance was proactively started by AWS Lambda 2 minutes before it is actually used. The real invocation duration is very short, but X-Ray wrongly shows the duration as 2 minutes.
Tracing code
The simplest way to trace custom code sections is using:
use Bref\Apm\XRay\XRay;

XRay::subSegment('doSomething', function () {
    // Your code here
});
Custom annotations
Annotations are indexed key-value pairs attached to a trace. Bref adds Route, Controller, Job, Command, and cold start annotations automatically. You can add your own, for example the tenant or the plan of the current user:
use Bref\Apm\XRay\XRay;

XRay::trace()->addAnnotation('tenant', $tenant->slug);
Call it during the request or the job, for example from a middleware or an event listener. Do not call it at boot time (for example in the boot() method of a service provider): the trace is reset after every invocation, so an annotation added at boot is only attached to the first invocation of the Lambda instance.
For example, with a Laravel middleware registered in the web middleware group:
namespace App\Http\Middleware;

use Bref\Apm\XRay\XRay;
use Closure;
use Illuminate\Http\Request;

class AnnotateTrace
{
    public function handle(Request $request, Closure $next)
    {
        $tenant = $request->user()?->tenant;
        if ($tenant) {
            XRay::trace()->addAnnotation('tenant', $tenant->slug);
        }

        return $next($request);
    }
}
X-Ray has constraints on annotations :
- keys can only contain letters, numbers and underscores (
feature_flagis valid,feature-flagis not) - values are strings
- a trace can have at most 50 annotations
The package does not validate these constraints, and AWS does not report invalid annotations back to your application.
In Bref Cloud, every annotation becomes a filter in the trace explorer (with Transaction Search enabled). For example, you can list all the traces of a given tenant over the last 30 days. Keep the number of possible values limited (an identifier or a category, not free text).
Tracing AWS SDK calls
Trace AWS SDK calls with the AwsSdkTracer::trace($client) method.
use Bref\Apm\XRay\AwsSdk\AwsSdkTracer;

$client = new EventBridgeClient([
    // ...
]);
AwsSdkTracer::trace($client);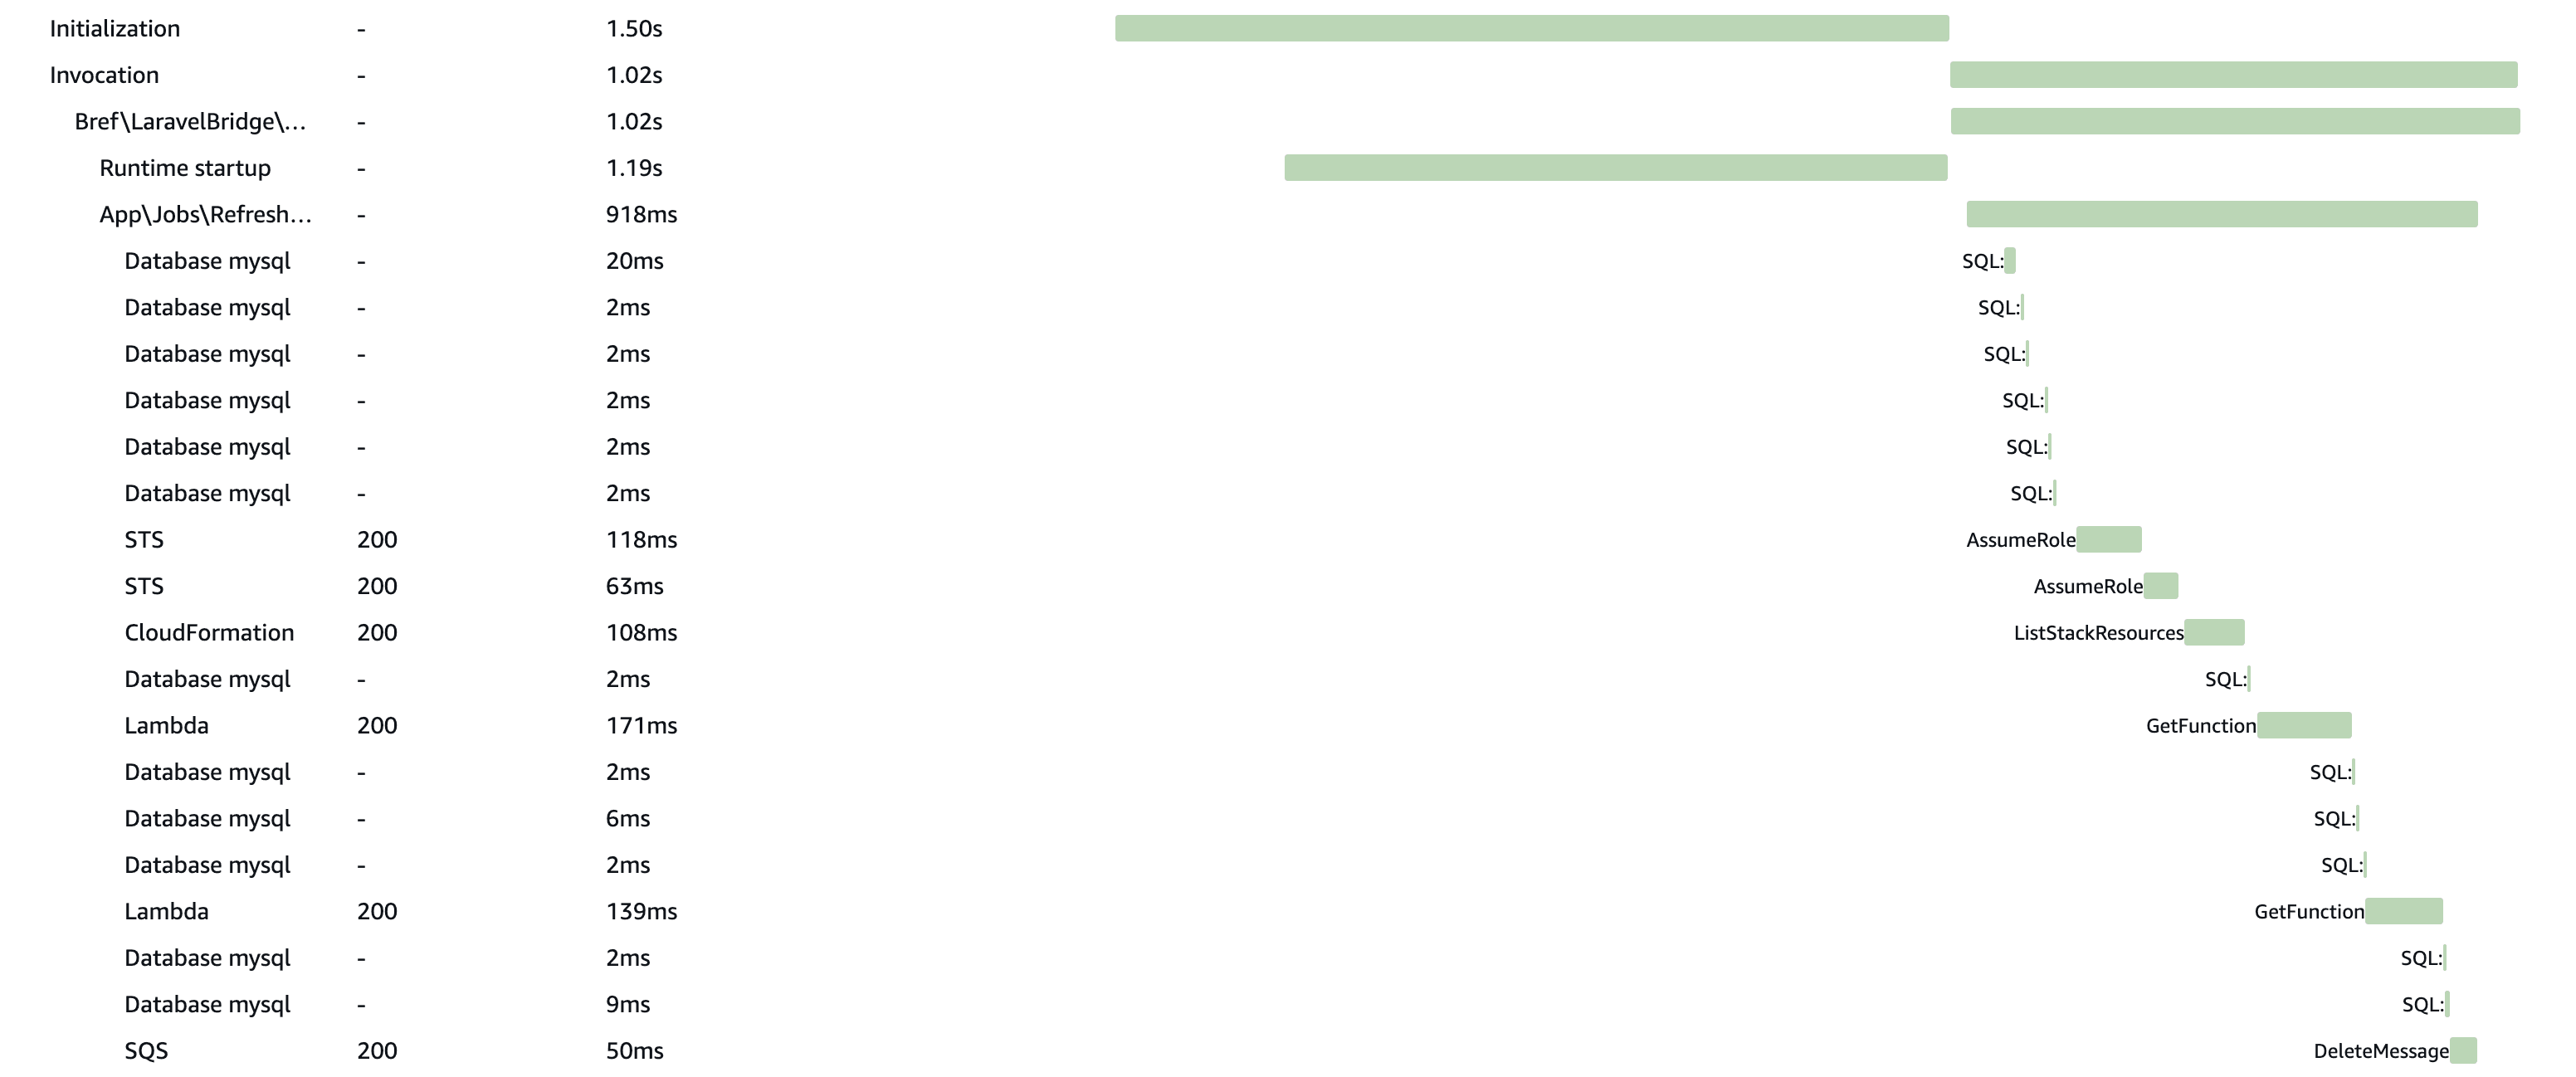
All calls will be traced and appear in the trace. However, only the first 10 requests will be sampled (i.e. will result in propagating tracing to the target AWS service). This is to avoid oversampling and hitting the X-Ray limit of 100 linked traces. For example, if a Lambda function sends 100 messages to SQS, only the first 10 Lambda invocations triggered by the SQS messages will create sub-traces. The other 90 invocations will appear as segments in the original trace, but will not create sub-traces.
Tracing Async-AWS SDK calls
Trace Async-AWS SDK calls by wrapping its HTTP client with TracedAsyncAwsHttpClient. For example:
use AsyncAws\Sqs\SqsClient;
use Bref\Apm\XRay\AsyncAws\TracedAsyncAwsHttpClient;

$sqs = new SqsClient([ /* config */ ], null, new TracedAsyncAwsHttpClient());
// or
$sqs = new SqsClient(httpClient: new TracedAsyncAwsHttpClient());
If you are configuring the HTTP client, you can pass it to the constructor:
use AsyncAws\Sqs\SqsClient;
use Bref\Apm\XRay\AsyncAws\TracedAsyncAwsHttpClient;
use Symfony\Component\HttpClient\HttpClient;

$httpClient = new TracedAsyncAwsHttpClient(HttpClient::create([
    // options
]));

$sqs = new SqsClient([ /* config */ ], null, $httpClient);
All calls will be traced and appear in the trace. However, only the first 10 requests will be sampled (i.e. will result in propagating tracing to the target AWS service). This is to avoid oversampling and hitting the X-Ray limit of 100 linked traces. For example, if a Lambda function sends 100 messages to SQS, only the first 10 Lambda invocations triggered by the SQS messages will create sub-traces. The other 90 invocations will appear as segments in the original trace, but will not create sub-traces.
Tracing Guzzle calls
Trace Guzzle calls with the GuzzleTracer::trace() middleware:
use GuzzleHttp\HandlerStack;
use GuzzleHttp\Client;

$stack = new HandlerStack();
$stack->push(\Bref\Apm\XRay\Guzzle\GuzzleTracer::trace());

$client = new Client(['handler' => $stack]);
If you are using Symfony, you can set that up in the service container:
    client:
        class: GuzzleHttp\Client
        arguments:
            - handler: '@xray.guzzle.handler_stack'
    xray.guzzle.handler_stack:
        shared: false
        class: GuzzleHttp\HandlerStack
        factory: [ GuzzleHttp\HandlerStack, create ]
        calls:
            - [ push, [ '@xray.guzzle.tracer_middleware' ] ]
The Guzzle integration correctly handles requests made in parallel using Guzzle’s async API and Guzzle pools.
Latency overhead
Based on our measurements, X-Ray tracing adds between 1ms to 2ms of latency per AWS Lambda invocation.